
Advanced Placement (AP), 07.01.2021 14:00 ogdeekin
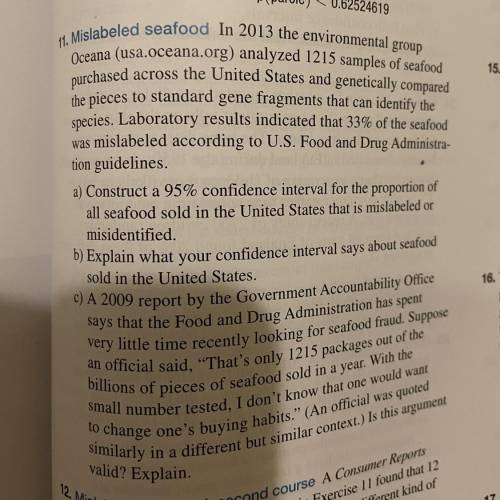
Mislabeled seafood In 2013 the environmental group Oceana (usa. oceana. org) analyzed 1215 samples of seafood purchased across the United States and genetically compared the pieces to standard gene fragments that can identify the species. Laboratory results indicated that 33% of the seafood was mislabeled according to U. S. Food and Drug Administration guidelines. Construct a 95% confidence interval for the proportion of all seafood sold in the United States that is mislabeled or misidentified.

Answers: 3
Another question on Advanced Placement (AP)
Advanced Placement (AP), 22.06.2019 06:10
Technician a says after tire service work tires and wheels must be in a state of static and dynamic balance in order to avoid vibration in service. technician b says tires and wheels are balanced at the factory and do not need further balancing. who is correct?
Answers: 1
Advanced Placement (AP), 23.06.2019 05:00
Which quality ensures that you are in a better position to represent yourself
Answers: 1
Advanced Placement (AP), 23.06.2019 21:30
According to binet, mental age relates to chronological age because a. they are the same thing b. mental age involves calculating the chronological age at which a person functions c. chronological age involves calculating how a person is mentally functioning d. they are opposites 38
Answers: 1
Advanced Placement (AP), 26.06.2019 08:00
The following table lists the birth rate, death rate, and net migration rate for egypt over the past 20 years. on a coordinate plane, plot the birth rate data and death rate data for egypt. clearly, show each data point and label each curve. be sure to label the graph and axes. save a copy of your graph. then answer the following questions: (14 points) a. what was the annual growth rate for egypt in 1990? what is the estimated annual growth rate in 2010? be sure to show your work for each answer. b. where does egypt most likely fall on the demographic transition model? explain your answer using data from the table. describe two changes within egyptian society that would likely be necessary for egypt to transition to the next stage in the model. c. assuming egypt’s current birth rate, death rate, and net migration rate trends continue, what will the country’s annual growth rate likely be in 2030? if this growth rate is accurate, what would its doubling time be in 2030?
Answers: 2
You know the right answer?
Mislabeled seafood In 2013 the environmental group Oceana (usa. oceana. org) analyzed 1215 samples o...
Questions


Geography, 08.05.2021 23:40

Arts, 08.05.2021 23:40
Mathematics, 08.05.2021 23:40

Social Studies, 08.05.2021 23:40

Biology, 08.05.2021 23:40
Mathematics, 08.05.2021 23:40
Mathematics, 08.05.2021 23:40
Biology, 08.05.2021 23:40


