
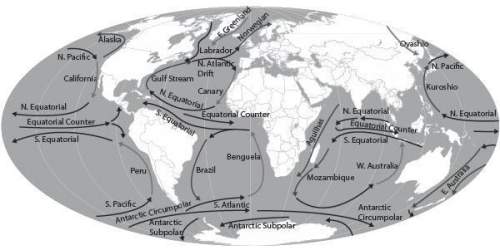
The figure below shows ocean currents. where will climate change slow the currents the most, causing colder temperatures, and why? a. along the eastern side of south america, because increased temperatures will slow the movement of the brazilian current and bring in cooler water b. along the kuroshio current, because it is carrying water north towards melting ice caps c. along the n. equatorial current, because climate change has its greatest effects at the equator d. along the northern coast of north america, because ice will melt in the arctic and slow the labrador and e. greenland currents that travel south

Answers: 2
Another question on Biology
Biology, 21.06.2019 18:30
What role do traits play in affecting an organisms ability to reproduce? finches
Answers: 1
Biology, 21.06.2019 20:00
How does the author's purpose in this passage differ from an author writing about her personal struggle living with asthma?
Answers: 1
Biology, 22.06.2019 01:30
Based on the law of dominance, we would expect percent of the offspring from this cross to have large teeth.
Answers: 2
Biology, 22.06.2019 03:00
To answer this question, researchers studied populations of the dusky salamander (desmognathus ochrophaeus) living on different mountain ranges in the southern appalachian mountains. the researchers tested the reproductive isolation of pairs of salamander populations by leaving one male and one female together and later checking the females for the presence of sperm. four mating combinations were tested for each pair of populations (a and b)—two within the same population (female a with male a and female b with male b) and two between populations (female a with male b and female b with male a). the proportion of successful matings for each mating combination was measured. for example, when all the matings of a particular combination were successful, the researchers gave it a value of 1; when none of the matings were successful, they gave it a value of 0. then the researchers calculated an index of reproductive isolation that ranged from 0 (no isolation) to 2 (full isolation). the reproductive isolation value for two populations is the sum of the proportion of successful matings of each type within populations (aa + bb) minus the sum of the proportion of successful matings of each type between populations (ab + ba). the table provides data for the geographic distances and reproductive isolation values for 27 pairs of dusky salamander populations.
Answers: 1
You know the right answer?
The figure below shows ocean currents. where will climate change slow the currents the most, causing...
Questions

Mathematics, 16.03.2020 21:33


English, 16.03.2020 21:33


Biology, 16.03.2020 21:33
Mathematics, 16.03.2020 21:33
History, 16.03.2020 21:33
Social Studies, 16.03.2020 21:33


Biology, 16.03.2020 21:33
Mathematics, 16.03.2020 21:33


