
Biology, 23.05.2020 18:57 elenagarcia123
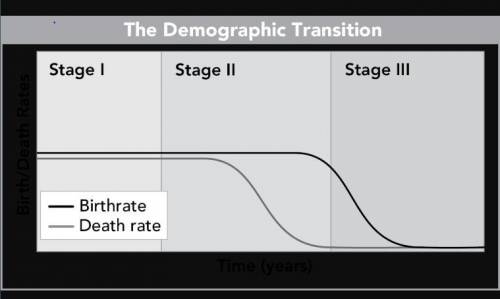
Demographers use graphs like this one to analyze patterns of population growth and decline.
The graph plots birthrate and death rate over time, in years. In Stage I, both rates begin relatively high. In Stage II, birth rate remains high while death rate decreases. At the end of Stage II and into Stage III, birthrate decreases to match the low death rate.
As Suzie conducts additional research on demography, she researches data on population growth in several countries.* Which of these steps would be most effective in assuring the accuracy of the data?*
A. Make sure that many sources agree with the data, and ignore sources that provide conflicting information.
B. Only cite sources that are trusted by the general public, such as popular magazines and newspapers.
C. Make sure data is provided by a reliable source, such as a government agency, a scientific journal, or a respected organization of scientists.
D. Only cite data that is at least 10 years old, because it is more likely to have been tested and be reliable than more recent data.

Answers: 3
Another question on Biology
Biology, 21.06.2019 14:00
How would you take a difficult subject matter - such as poaching, deforestation, or climate change and communicate it in a kid-friendly way
Answers: 1
Biology, 21.06.2019 23:10
You arrive late to a biological seminar. however, just as you enter the room, you hear the speaker referring to the "five-prime end" and the "three-prime end" of a macromolecule. immediately, you know that they are talking about a: ]
Answers: 1
Biology, 22.06.2019 14:30
Find the mass of the cone using the triple beam balance. a. 543.0 g b. 542.0 g c. 504.28 g d. 502.8 g select the best answer from the choices provided a b c d
Answers: 3
You know the right answer?
Demographers use graphs like this one to analyze patterns of population growth and decline.
Questions

History, 30.03.2020 22:32

Mathematics, 30.03.2020 22:32
Mathematics, 30.03.2020 22:32


Computers and Technology, 30.03.2020 22:32
Mathematics, 30.03.2020 22:32

Mathematics, 30.03.2020 22:32


