
Biology, 20.09.2020 19:01 HeyItsCookie9605
Select the correct answer.
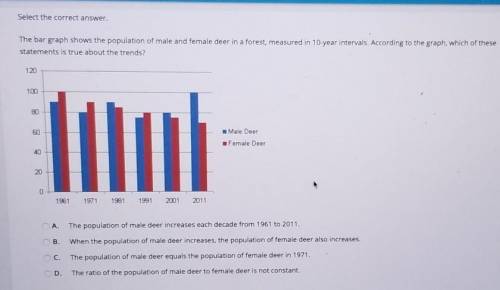
The bar graph shows the population of male and female deer in a forest, measured in 10-year intervals. According to the graph, which of these
statements is true about the trends?
120
100
80
60
Male Deer
Female Deer
40
20
0
1961
1971
1981
1991
2001
2011
A.
The population of male deer increases each decade from 1961 to 2011.
B.
When the population of male deer increases, the population of female deer also increases.
C.
The population of male deer equals the population of female deer in 1971.
D.
The ratio of the population of male deer to female deer is not constant.

Answers: 1
Another question on Biology
Biology, 21.06.2019 22:30
How can you approximate the number of calories required to keep you in energy balance?
Answers: 2
Biology, 22.06.2019 02:30
Sally and sue were investigating the topic of friction in science. they used a small car and a ramp as seen in the picture to test what they were learning. they knew that they slipped easily on waxed floors but not on carpet, so they decided to change the material on the surface of the ramp to see what happened. they planned to use glass, carpet, aluminum foil, and sandpaper and run the car down the ramp over each surface. what would be the best research question to guide the girls' experiment? a) does the amount of surface area affect the friction on the moving car? b) will the car travel fastest on the glass surface? c) how does the angle of the ramp affect the speed of the car? d)do rougher surfaces tend to create more friction than smooth surfaces?
Answers: 1
Biology, 22.06.2019 12:20
Agene editing technology called crispr-cas9 uses cellular machinery to change the cell's genetic material. how might this technology be useful in treating diseases like cancer?
Answers: 3
You know the right answer?
Select the correct answer.
The bar graph shows the population of male and female deer in a forest...
Questions


Mathematics, 18.09.2019 17:10
History, 18.09.2019 17:10


Business, 18.09.2019 17:10
Mathematics, 18.09.2019 17:10

Business, 18.09.2019 17:10

Mathematics, 18.09.2019 17:10


