
Biology, 22.10.2020 22:01 tayshhah3945
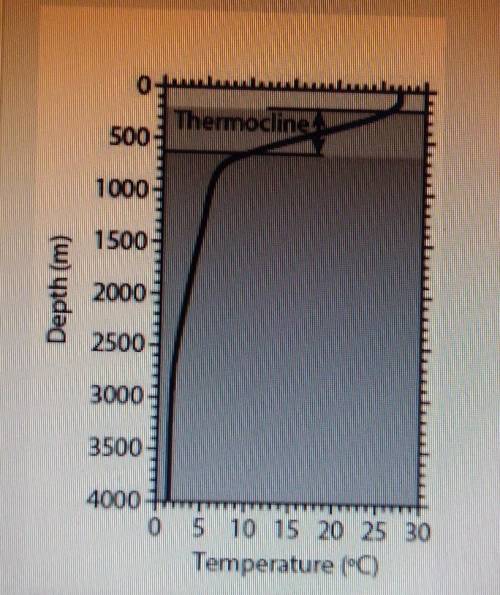
Use the graph to describe the effect on temperature as depth increases:
- as depth increases, temperature remains the same.
- as depth increases, temperature increases.
- as depth increases, temperature increases then decreases.
- as depth increases, temperature decreases quickly at first, but eventually becomes constant.

Answers: 1
Another question on Biology
Biology, 22.06.2019 14:30
Which line in the graph above best illustrates an effect of the carbon dioxide level in the blood on breathing rate before, during and after a period of exercise? 1.b,2.c,3.a,4.d
Answers: 1
Biology, 22.06.2019 16:00
Why were the results whit just water so much different than the trials with the detergent ?
Answers: 3
Biology, 22.06.2019 19:20
16 select the correct answer from each drop-down menu. sharks, whales, and dolphins share similar features such as body shape and the position of fins. hoy while whales and dolphins have lungs. these differences indicate that the organisms share a comme whales also possess a vestigial pelvic bone. the presence of the pelvis bone may indicate that whales reset next
Answers: 2
Biology, 22.06.2019 20:10
What will happen to the amount of food available as a pondwater ecosystem ages
Answers: 1
You know the right answer?
Use the graph to describe the effect on temperature as depth increases:
- as depth increases, tempe...
Questions

Mathematics, 09.10.2019 22:40

History, 09.10.2019 22:40
Mathematics, 09.10.2019 22:40
Mathematics, 09.10.2019 22:40
History, 09.10.2019 22:40

Biology, 09.10.2019 22:40

Mathematics, 09.10.2019 22:40

Social Studies, 09.10.2019 22:40
Biology, 09.10.2019 22:40

Social Studies, 09.10.2019 22:40


