
Biology, 19.11.2020 19:20 kprincess16r
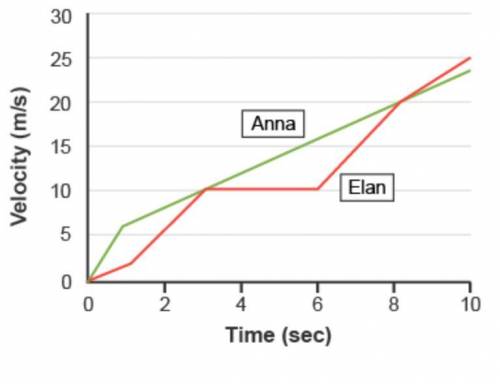
The graph depicts the velocity and times of Elan and Anna during a race.
Which best depicts the data?
A) From 0 to 2 seconds, Anna experienced negative acceleration.
B) From 3 to 6 seconds, Elan accelerated while Anna did not.
C) From 6 to 8 seconds, Elan accelerated faster than Anna.
D) From 8 to 10 seconds, Elan experienced negative acceleration.

Answers: 1
Another question on Biology
Biology, 22.06.2019 07:50
45 points how are people today being protected from tsunamis? earthquake data is analyzed to detemrine if a tsunami is likely, and if so, warnings are sent out. areas in tsunami risk zones are no longer heavily populated. radar is used to measure wave heights regularly. meteorologists study the winds to determine if wave heights will be large.
Answers: 1
Biology, 22.06.2019 08:00
Acell goes through cellular respiration and produces atp which it then uses to move a molecule across the cell membrane. how does the energy in the original glucose molecule change during this process? (2 points)
Answers: 1
Biology, 22.06.2019 10:00
An animal cell (left) and a plant cell (right) are shown.which organelle, labeled x in the diagram, is found in both plant and animal cells?
Answers: 1
You know the right answer?
The graph depicts the velocity and times of Elan and Anna during a race.
Which best depicts the dat...
Questions


Mathematics, 13.12.2021 14:00

Law, 13.12.2021 14:00
Mathematics, 13.12.2021 14:00
Mathematics, 13.12.2021 14:00
Mathematics, 13.12.2021 14:00
Mathematics, 13.12.2021 14:00

Chemistry, 13.12.2021 14:00
Mathematics, 13.12.2021 14:00
Mathematics, 13.12.2021 14:00
Mathematics, 13.12.2021 14:00
Mathematics, 13.12.2021 14:00

English, 13.12.2021 14:00
Mathematics, 13.12.2021 14:00


