1 pts
Question 3
3. Based on the table below, what pattern do you see in the data?
Tabl...

Biology, 17.12.2020 17:50 shaakiraak
1 pts
Question 3
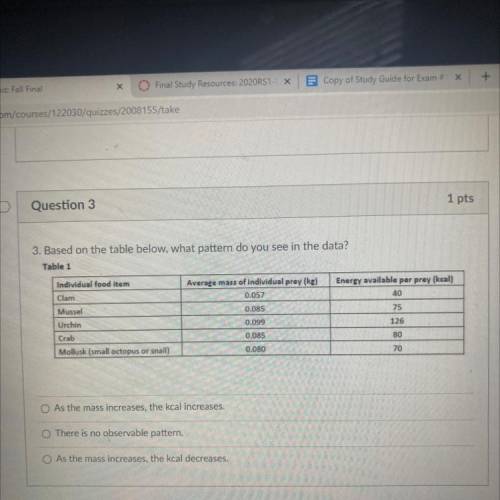
3. Based on the table below, what pattern do you see in the data?
Table 1
Energy available per prey (kcal)
40
75
Individual food item
Clam
Mussel
Urchin
Crab
Mollusk (small octopus or snail)
Average mass of individual prey (ke)
0.057
0.085
0.099
0.085
0.080
126
80
70
As the mass increases, the kcal increases.
There is no observable pattern.
O As the mass increases, the kcal decreases.

Answers: 2
Another question on Biology
Biology, 22.06.2019 08:00
What is usually (but not always) related to the metabolic processes of living organisms in its organic form?
Answers: 1
Biology, 22.06.2019 16:00
Qué sucede cuando una persona tiene muy poco o demasiado costeroides?
Answers: 1
You know the right answer?
Questions


Health, 25.02.2020 20:46
Health, 25.02.2020 20:46


History, 25.02.2020 20:46
Mathematics, 25.02.2020 20:46
Mathematics, 25.02.2020 20:46


