
Biology, 09.02.2021 01:00 desderievelasquez
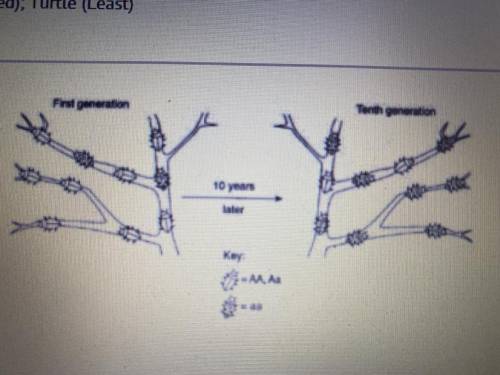
The diagram illustrates the change that occurred in a bug population over 10 years, a probable explanation for this change would be that over time there was -
A) A decrease in the frequency of allele “a” to adapt
B) An increase in the frequency of allele “a” to adapt
C) An increase in the population of the insect
D) A decrease in the mutation rate of allele “A”

Answers: 1
Another question on Biology
Biology, 22.06.2019 06:30
Explain how scientists use geologic time to determine the age of landforms.
Answers: 1
Biology, 22.06.2019 10:50
What is it called when part of a cell membrane closes around a molecule to allow the molecule to enter the cell? a. passive transport b.diffusion c. endocytosis d. exocytosisc. endocytosis
Answers: 2
Biology, 22.06.2019 11:00
Match the following terms and definitions. 1. species that are adapted to live in equilibrium at carrying capacity population density 2. population growth that reaches equilibrium and carrying capacity population 3. death rate mortality 4. birth rate k-selected 5. a group of interacting individuals of the same species within the same geographic area natality 6. the number of organisms living in a particular area logistic growth
Answers: 1
You know the right answer?
The diagram illustrates the change that occurred in a bug population over 10 years, a probable expla...
Questions


English, 07.06.2020 04:00
Mathematics, 07.06.2020 04:00

Social Studies, 07.06.2020 04:00

French, 07.06.2020 04:00

History, 07.06.2020 04:00
History, 07.06.2020 04:00
Mathematics, 07.06.2020 04:00
Mathematics, 07.06.2020 04:00
Mathematics, 07.06.2020 04:00

Mathematics, 07.06.2020 04:01


