Point
The graph illustrates an experiment in which pieces of potato were placed
into solution...

Biology, 11.02.2021 07:30 houtchhaytang
Point
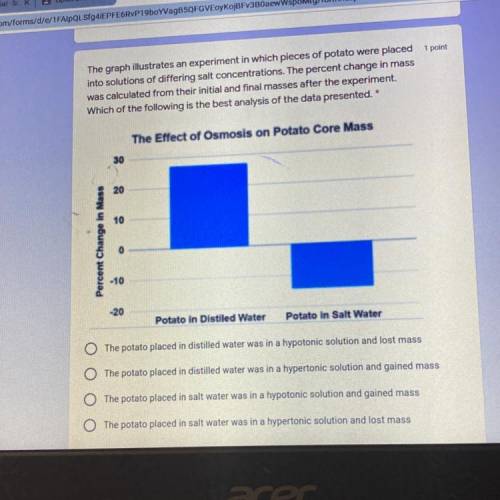
The graph illustrates an experiment in which pieces of potato were placed
into solutions of differing salt concentrations. The percent change in mass
was calculated from their initial and final masses after the experiment.
Which of the following is the best analysis of the data presented. *

Answers: 2
Another question on Biology
Biology, 21.06.2019 22:30
White-tailed deer are considered to be an overpopulated species in the central united states. which of these events probably contributed the most to white-tailed deer exceeding their carrying capacity?
Answers: 1
You know the right answer?
Questions


Mathematics, 07.12.2019 01:31
Biology, 07.12.2019 01:31
Mathematics, 07.12.2019 01:31
Mathematics, 07.12.2019 01:31
Chemistry, 07.12.2019 01:31
Mathematics, 07.12.2019 01:31
Mathematics, 07.12.2019 01:31


