
Biology, 11.02.2021 21:10 kkmonsterhigh18
CER - Analyzing Data and Tiger Sharks
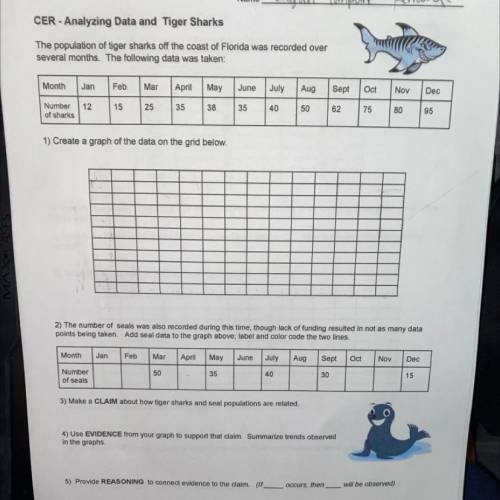
The population of tiger sharks off the coast of Florida was recorded over
several months. The following data was taken:
MonthJan:FebMarAprilMay
June JulyAugSeptOctNovDec
12
15
25
35
38
35
Number
of sharks
40
50
62
75
80
95
1) Create a graph of the data on the grid below.
2) The number of seals was also recorded during this time, though lack of funding resulted in not as many data
points being taken. Add seal data to the graph above; label and color code the two lines.
Month
Jan
Feb
Mar
April
June
July
Aug
May
Sept
Oct
Nov
Dec
50
40
35
30
15
Number
of seals
3) Make a CLAIM about how tiger sharks and seal populations are related.

Answers: 3
Another question on Biology
Biology, 22.06.2019 08:30
Which of the follow describes a disadvantage secondary sources have compared to primary sources?
Answers: 1
Biology, 22.06.2019 12:30
No plagiarizing ! 6th grade work! easy and 100 compare the parts of a cell and the cell as a whole to another common nonliving system (i.e., a car, a city, describe the parts of a cell and their primary function.
Answers: 1
You know the right answer?
CER - Analyzing Data and Tiger Sharks
The population of tiger sharks off the coast of Florida was r...
Questions


