
Biology, 05.03.2021 19:20 sweetcandy16gaming
This chart gives data on greenhouse gas emissions in the United States from 1990 to 2013. Which questions would help clarify the evidence in the chart? Select ALL the correct answers.
1. What percentage of total greenhouse gas emissions is caused by natural source?
2. Should industries emitting carbon dioxide in huge amounts be fined or punished?
3. Why are carbon dioxide emissions so much higher than other greenhouse gases?
4. Why did the quantity of carbon dioxide emissions stay constant throughout the period?
5. What is the chemical formula for methane?
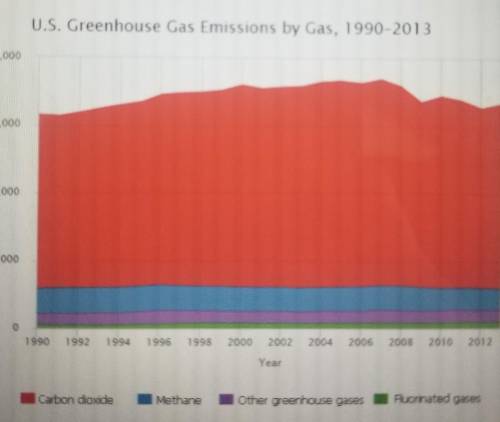

Answers: 1
Another question on Biology
Biology, 21.06.2019 15:00
If someone could do the first couple, just so i can see how it's done that would be great! 20 points. complete a dichotomous key for the 10 leaves on the common leaves sheet. the chart provided here allows for 11 pairs of statements. depending on how you build your dichotomous key, you may or may not need all of them, or you may need to add some.
Answers: 2
Biology, 21.06.2019 20:00
Which type of bacterial reproduction is depicted in the diagram?
Answers: 2
Biology, 22.06.2019 04:20
Do you think the gene eef1 alpha1 supports cell theory? explain your response.
Answers: 2
Biology, 22.06.2019 09:00
What causes eclipses? check all that apply. earth's rotation on its axis moon's shadow covering the sun earth's shadow covering the moon earth's orbit and moon's orbit occasionally aligning the moon and sun's gravity pulling in the same direction
Answers: 3
You know the right answer?
This chart gives data on greenhouse gas emissions in the United States from 1990 to 2013. Which ques...
Questions

Mathematics, 02.03.2020 02:18

Mathematics, 02.03.2020 02:18
Mathematics, 02.03.2020 02:19

Mathematics, 02.03.2020 02:19

Social Studies, 02.03.2020 02:19

History, 02.03.2020 02:19
Mathematics, 02.03.2020 02:19
History, 02.03.2020 02:20
Biology, 02.03.2020 02:20
Mathematics, 02.03.2020 02:20

Chemistry, 02.03.2020 02:20
Mathematics, 02.03.2020 02:20


