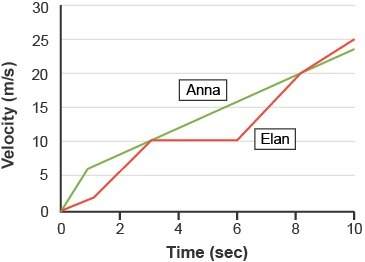
The graph depicts the velocity and times of elan and anna during a race
which best depicts the...

Biology, 30.09.2019 19:30 tiadenae22ovtxdr
The graph depicts the velocity and times of elan and anna during a race
which best depicts the data?
a)from 0 to 2 seconds, anna experienced negative acceleration.
b)from 3 to 6 seconds, elan accelerated while anna did not.
c)from 6 to 8 seconds, elan accelerated faster than anna.
d)from 8 to 10 seconds, elan experienced negative acceleration.

Answers: 2
Another question on Biology
Biology, 22.06.2019 00:10
Ineed some everybody. the production of cells during mitosis into specialized function is called: recombination or differentiation
Answers: 1
Biology, 22.06.2019 02:00
Sara goes on a slingshot ride in an amusement park. she is strapped into a spherical ball that has a radius 3*10^2 of centimeters. what is the volume of air in the spherical ball? use this formula: volume of a sphere=4/3pi,r^3 , where r is the sphere’s radius.
Answers: 1
Biology, 22.06.2019 03:30
How can active reading strategies you? o a. they can you get into better physical shape. o b. they can you read fewer science articles. o c. they can you understand what you read. o d. they can you avoid reading altogether.
Answers: 1
Biology, 22.06.2019 05:20
Categorize each term as something that is typical of a scientific theory, a scientific hypothesis, or both. makes predictions
Answers: 2
You know the right answer?
Questions


Mathematics, 06.11.2020 21:50

Computers and Technology, 06.11.2020 21:50

Chemistry, 06.11.2020 21:50
Mathematics, 06.11.2020 21:50

English, 06.11.2020 21:50

Mathematics, 06.11.2020 21:50

Geography, 06.11.2020 21:50
Mathematics, 06.11.2020 21:50

Business, 06.11.2020 21:50
Mathematics, 06.11.2020 21:50

Mathematics, 06.11.2020 21:50

Mathematics, 06.11.2020 21:50


