
Biology, 22.05.2021 08:30 jaylanmahone223
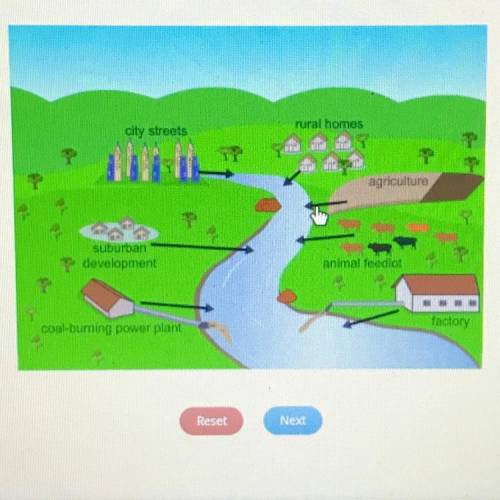
Select the correct arrowheads on the image.
The image shows point and non-point sources of water pollution. Which two sources are point sources of water pollution?
rural homes
city streets
agriculture
suburban
development
animal feedlot
coal-burning power plant
factory

Answers: 1
Another question on Biology
Biology, 21.06.2019 20:20
Which best describes an adaptation that could be found in a fish that lives in a slow-flowing stream? the ability to attract prey by glowingextra gills, for oxygen extractionthe ability to grow largerextra fat, for warmth
Answers: 2
Biology, 21.06.2019 22:40
Environmental differences within ecosystems are generally caused by
Answers: 1
Biology, 22.06.2019 00:10
Recent research by marine biologists suggests that bottlenose dolphins have names for themselves. scientists played sounds they had identified as the names of particular dolphins, putting them through a synthesizer so that they did not sound like the voices of particular dolphins. the researchers found that dolphins would respond to the names of other dolphins that they were related to or associated with, but they ignored the names of strangers. this discovery suggests a much greater degree of self-awareness in aquatic mammals than was previously suspected. if this research holds up, what does it suggest about dolphins?
Answers: 3
Biology, 22.06.2019 01:30
Scenario 5 1) take 10 red and 10 black beans and place them, mixed, on the table. record the starting phenotype # and frequencies (% of your total population) of your starting population in the table provided (generation 0). 2) act as a predator. “capture” as many organisms as you can until you have reduced the population to three organisms. put them aside. at this point, the predators die. 3) the remaining organisms each produce 2 clonal offspring. multiply your organisms accordingly and allow them to mix on the table. calculate and record the resultant phenotype # and frequencies (% of your total population) of your population in the table provided (generation 1). 4) repeat the reproduction event, allowing each of your organisms to produce 2 clonal offspring. calculate and record the resultant phenotype # and frequencies (% of your total population) of your population in the table provided (generation 2). 5) repeat the reproduction event, allowing each of your organisms to produce 2 clonal offspring. calculate and record the resultant phenotype # and frequencies (% of your total population) of your population in the table provided (generation 3).
Answers: 1
You know the right answer?
Select the correct arrowheads on the image.
The image shows point and non-point sources of water po...
Questions


Mathematics, 17.08.2021 16:30

Mathematics, 17.08.2021 16:30
Mathematics, 17.08.2021 16:30

Computers and Technology, 17.08.2021 16:30

Social Studies, 17.08.2021 16:30
Mathematics, 17.08.2021 16:30
Computers and Technology, 17.08.2021 16:30


Physics, 17.08.2021 16:30

Spanish, 17.08.2021 16:30


