
Biology, 14.06.2021 23:40 Savageman4654
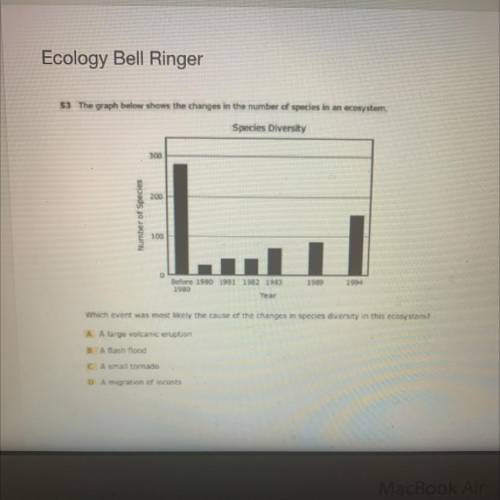
53 The graph below shows the changes in the number of species in an ecosystem
Species Diversity
300
200
Number of Species
|..
100
و 12 19 0
1989
1994
1980
Year
Which event was most likely the cause of the changes in species diversity in this ecosystem?
A large volcanic eruption
B A flash flood
Amatorado
D Amigration of cuts

Answers: 3
Another question on Biology
Biology, 21.06.2019 22:00
An ecologist is studying the effects that a population of predators is having on a population of a prey. he used data from the field to produce this graph. which conclusion can draw from the graph?
Answers: 3
Biology, 22.06.2019 01:30
All individuals have two alleles for a given trait. according to mendel's these alleles are passed down one each from both mother and father.
Answers: 1
Biology, 22.06.2019 01:40
Control of the body is accomplished by which of the following body systems? nervous system and circulatory system endocrine and repertory system circulatory and respiratory systems nervous system and endocrine systems
Answers: 1
Biology, 22.06.2019 03:00
Wich organism obtains its energy from dead or decaying matter
Answers: 1
You know the right answer?
53 The graph below shows the changes in the number of species in an ecosystem
Species Diversity
Questions


Health, 02.04.2021 22:10

Health, 02.04.2021 22:10

Mathematics, 02.04.2021 22:10
Mathematics, 02.04.2021 22:10


Arts, 02.04.2021 22:10


