
Biology, 25.11.2021 14:00 Nainaigurl1
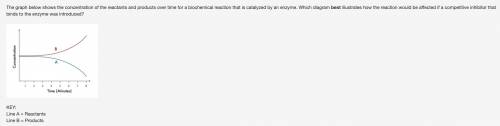
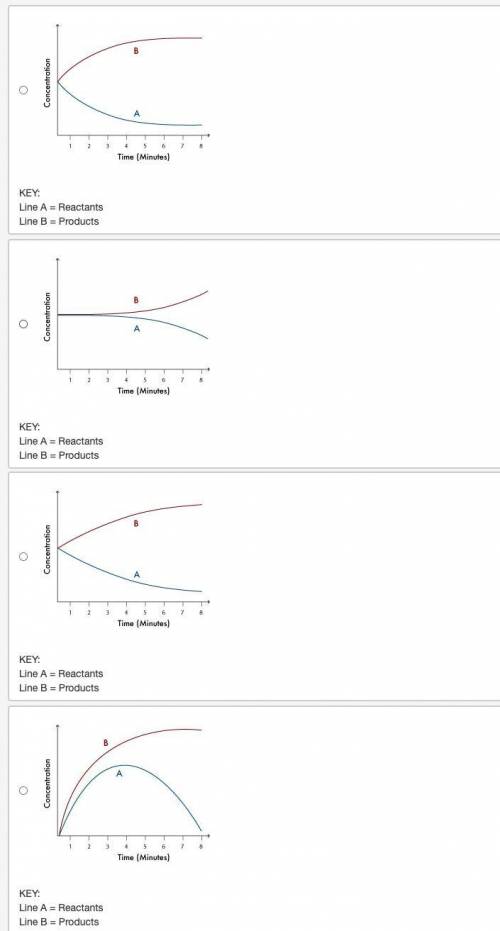
The graph below shows the concentration of the reactants and products over time for a biochemical reaction that is catalyzed by an enzyme. Which diagram best illustrates how the reaction would be affected if a competitive inhibitor that binds to the enzyme was introduced?

Answers: 1
Another question on Biology
Biology, 22.06.2019 04:00
As studied this week in the cell cycle, we saw how a cell moves through its life with a plan. as you transition from a student at uma to a valued member of your chosen career field, what will you put into place in your life to manage and to fit the new responsibilities of your career into your current life?
Answers: 2
Biology, 22.06.2019 15:30
(me out over the last several centuries, scientists have made the following broad observations while investigating several branches of the life sciences: -the fossil record shows that different types of organisms have existed at different times in earth's history. -many organisms have similar body structures that seem to be adapted to different ways of living in their environment. -organisms of different species often share similarities in stages of embryonic development. -many species share genetic similarities, and almost all organisms use the same basic building blocks to construct proteins. -often, the extent of two species' similarities can be predicted from their geographic closeness to each other. -a great deal of change has been observed among species that have experienced strong selective pressures through many generations. scientists have carefully considered and rigorously tested the observations listed above. when scientists offer a of these observations, they are making 1.) testable explanation, deductive explanation 2.) scientific interference, scientific law
Answers: 3
Biology, 22.06.2019 23:00
You are studying several alleles of an e. coli helicase gene. one allele, called rsr, confers resistance to rs2014, an antibiotic that works by inhibiting helicase activity. bacteria with the rss allele are sensitive to rs2014. another allele, called ts-, produces a temperature sensitive mutation of the helicase. in bacteria with the ts- allele, helicase is inactivated at 42 °c but functions normally at 37 °c. helicase functions normally at both temperatures in bacteria with the ts allele. you obtain the following data while testing four strains of e. coli at different temperatures and doses of rs2014. each number represents the percentage of maximal dna synthesis. based on this data, assign the appropriate genotype to strains a–d in the spaces provided
Answers: 1
You know the right answer?
The graph below shows the concentration of the reactants and products over time for a biochemical re...
Questions

Mathematics, 20.10.2019 01:50
Mathematics, 20.10.2019 01:50

English, 20.10.2019 01:50


Mathematics, 20.10.2019 01:50

History, 20.10.2019 01:50
Mathematics, 20.10.2019 01:50

Mathematics, 20.10.2019 01:50
Mathematics, 20.10.2019 01:50
English, 20.10.2019 01:50
Mathematics, 20.10.2019 01:50
History, 20.10.2019 01:50


