
An instrument is gradually lowered beneath the surface of the ocean to measure the temperature and salinity of the water. The graphs below show the change in temperature at each depth in kilometers below the surface.
Image of two graphs. The left graph has the x axis labeled temperature degree C ranging from 0 to 10. The y axis is labeled depth below surface, km, ranging from negative 1.8 to 0. The line on graph goes up vertically starting at about 2 degree C on the x axis and negative 1.9 km on the y axis. The vertical line goes up staying at about 2 degree C and climbs from negative 1.9 km to about negative 0.8 km. The line starts to shift right at negative 0.6 km. The line shifts to the right from 2 degree C to 5 degree C. The line shifts to right more starting at negative 0.5 km and reaches 10 degree C around negative 0.2 km. The line continues up vertically after negative 0.2 km. The right graph has the x axis labeled salinity ranging from 33.8 to 34.6. The y axis is labeled depth below surface, km, ranging from negative 1.8 to 0. The line on the graph starts at 34 on the x axis and 0 km on the y axis. The line starts to shift to the right at negative 0.1 km and levels out at 34.2 on the x axis. At negative 0.2 km the line shifts to the left and continues to shift left until it reaches negative 0.5 km. The line starts to shift to the right again at negative 0.6 and continues to shift right until it reaches negative 1.9 km on the y axis and 34.6 on the x axis.
What is the most valid conclusion regarding ocean depth temperature, based on the data?
A.) The temperature and salinity increase with increasing depth.
B.) The salinity increases as the depth goes closer to zero.
C.) The bottom of the ocean is frozen and salinity levels are low.
D.) The ocean temperature never rises above 10°C and salinity remains constant.
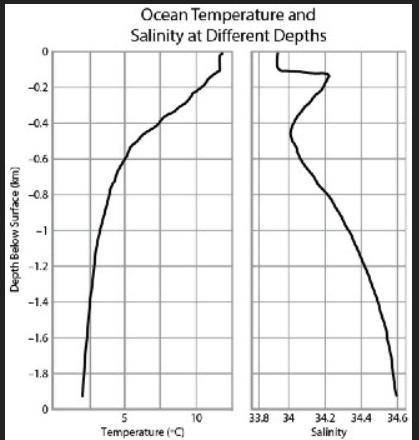

Answers: 3
Another question on Biology
Biology, 22.06.2019 06:30
Areal dna molecule consists of thousands of these pairs of nucleotides. what is the pairing arrangement of the nitrogen bases
Answers: 1
Biology, 22.06.2019 07:00
Common symptoms of an iron-defiency anemia include muscle weakness shortness of breath and lightheadedness why does iron deficiency causes these symptoms
Answers: 2
Biology, 22.06.2019 08:30
What does polymerase chain reaction (pcr) do? o a. separates dna fragments by size o b. cuts a dna sample into fragments o c. provides an overall picture of a person's chromosomes o d. makes more copies of a sample of dna
Answers: 2
Biology, 22.06.2019 16:10
Several bodily responses are described below. for each response, determine what caused the change in homeostasis. body starts to sweat breathing rate increases amount of saliva produced changes body starts to shiver
Answers: 3
You know the right answer?
An instrument is gradually lowered beneath the surface of the ocean to measure the temperature and s...
Questions

Mathematics, 01.08.2021 15:10
Mathematics, 01.08.2021 15:10

Arts, 01.08.2021 15:10

English, 01.08.2021 15:10

Physics, 01.08.2021 15:10

Mathematics, 01.08.2021 15:10
Physics, 01.08.2021 15:10

Chemistry, 01.08.2021 15:10
Mathematics, 01.08.2021 15:10
Mathematics, 01.08.2021 15:20

History, 01.08.2021 15:20

Business, 01.08.2021 15:20
Business, 01.08.2021 15:30
English, 01.08.2021 15:30

Social Studies, 01.08.2021 15:30
English, 01.08.2021 15:30
Law, 01.08.2021 15:30


