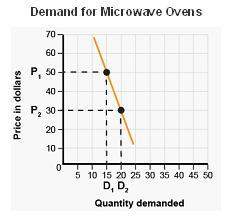
The graph shows the price of a good compared to the quantity demanded.
this graph demonstrates...

Business, 18.09.2019 18:20 Jazzyyyy088888
The graph shows the price of a good compared to the quantity demanded.
this graph demonstrates how
a. the amount produced slightly changes with the price.
b. the amount produced greatly changes with the price.
c. the quantity demanded changes slightly with the price.
d. the quantity demanded changes greatly with the price.

Answers: 1
Another question on Business
Business, 22.06.2019 03:30
Lo.2, 3, 9 lori, who is single, purchased 5-years class property for $200,00 and 7-years class property for $420,000 on may 20, 2018. lori experts the taxable income derived form the business (without regard to the amount expensed under ⧠179) to be about $550,000. lori has determined that she should elect immediate ⧠179 expensing in the amount of $520,000, but she doesn’t know which asset she should completely expense under ⧠179. she does not claim any available additional first-year depreciation. a. determine lori’s total cost recovery deduction if the ⧠179 expense is first taken with respect to the 5-year class asset. b. determine lori’s total cost recovery deduction if the ⧠179 expense is first taken with respect to the 7-year class asset. c. what is your advice for lori? d. assume that lori is in the 24% marginal tax bracket and that she uses ⧠179 on the 7-year asset. determine the present value of the tax savings from the depreciation deductions for both assets. see appendix g for present value factors, and assume a 6% discount rate. e. assume the same facts as in part (d), except that lori decides not to use ⧠179 on either asset. determine the present value of the tax savings under this choice. in addition, determine which option lori should choose. f. present your solution to parts (d) and (e) of the problem in a spreadsheet using appropriate microsoft excel formulas. e-mail your spreadsheet to your instructor with a two-paragraph summary of your findings.
Answers: 1
Business, 22.06.2019 15:00
Portia grant is an employee who is paid monthly. for the month of january of the current year, she earned a total of $8,388. the fica tax for social security is 6.2% of the first $118,500 earned each calendar year and the fica tax rate for medicare is 1.45% of all earnings. the futa tax rate of 0.6% and the suta tax rate of 5.4% are applied to the first $7,000 of an employee's pay. the amount of federal income tax withheld from her earnings was $1,391.77. what is the total amount of taxes withheld from the portia's earnings?
Answers: 2
Business, 22.06.2019 20:30
This problem has been solved! see the answercompute and interpret altman's z-scoresfollowing is selected financial information for ebay, for its fiscal years 2005 and 2006.(in millions, except per share data) 2006 2005current assets $ 4,970.59 $ 3,183.24current liabilities 2,518.39 1,484.93total assets 13,494.01 11,788.99total liabilities 2,589.38 1,741.00shares outstanding 1,368.51 1,404.18retained earnings 4,538.35 2,819.64stock price per share 30.07 43.22sales 5,969.74 4,552.40earnings before interest and taxes 1,439.77 1,445.18compute and interpret altman z-scores for the company for both years. (do not round until your final answer; then round your answers to two decimal places.)2006 z-score = answer2005 z-score = answerwhich of the following best describes the company's likelihood to go bankrupt given the z-score in 2006 compared to 2007.the z-score in 2006 is half of the 2005 score. both z-scores are well above the score that represents a healthy company.the z-score in 2006 is double the 2005 score. the z-score has increased sharply, which suggests the company has greatly increased the risk of bankruptcy.the z-score in 2006 is half of the 2005 score. the z-score has decreased sharply, which suggests the company is in financial distress.the z-score in 2006 is double the 2005 score. the z-score has increased sharply, which suggests the company has greatly lowered the risk of bankruptcy.
Answers: 3
Business, 22.06.2019 21:40
Heather has been an active participant in a defined benefit plan for 19 years. during her last 6 years of employment, heather earned $42,000, $48,000, $56,000, $80,000, $89,000, and $108,000, respectively (representing her highest-income years). calculate heather’s maximum allowable benefits from her qualified plan (assume that there are fewer than 100 participants). assume that heather’s average compensation for her three highest years is $199,700. calculate her maximum allowable benefits.
Answers: 3
You know the right answer?
Questions

History, 09.04.2020 21:33


English, 09.04.2020 21:34
History, 09.04.2020 21:34
History, 09.04.2020 21:34


Arts, 09.04.2020 21:34
History, 09.04.2020 21:34
Mathematics, 09.04.2020 21:34


