
Business, 28.02.2020 04:20 GreenHerbz206
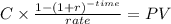
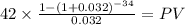
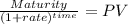
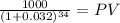
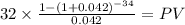
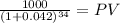
Bond X is a premium bond making semiannual payments. The bond has a coupon rate of 8.4 percent, a YTM of 6.4 percent, and has 17 years to maturity. Bond Y is a discount bond making semiannual payments. This bond has a coupon rate of 6.4 percent, a YTM of 8.4 percent, and also has 17 years to maturity. Assume the interest rates remain unchanged and both bonds have a par value of $1,000.
1. What are the prices of these bonds today?
2. What do you expect the prices of these bonds to be in one year?
3. What do you expect the prices of these bonds to be in three years?
4. What do you expect the prices of these bonds to be in eight years?
5. What do you expect the prices of these bonds to be in 12 years?
6. What do you expect the prices of these bonds to be in 17 years?

Answers: 1
Another question on Business
Business, 21.06.2019 18:20
The sticky-price theory asserts that the output prices of some goods and services adjust slowly to changes in the price level. suppose firms announce the prices for their products in advance, based on an expected price level of 100 for the coming year. many of the firms sell their goods through catalogs and face high costs of reprinting if they change prices. the actual price level turns out to be 110. faced with high menu costs, the firms that rely on catalog sales choose not to adjust their prices. sales from catalogs will
Answers: 3
Business, 22.06.2019 00:30
A) plot the m1 and m2 money stock in the us from 1990-2015. (hint: you may use the data tools provided by fred.) (b) plot the nominal interest rate from 1960 to 2014. (hint: you can either use the daily interest rates for selected u.s. treasury, private money market and capital market instruments from or the effective federal funds rate fromfred.) (c) the consumer price index (cpi) is a measure of the average change over time in the prices paid by urban consumers for a market basket of consumer goods and services. intuitively, the cpi represents the cost of living or the average price level. plot the cpi from 1960 to 2013.(d) the inflation rate is the yearly percentage change in the average price level. in practice, we usually use the percentage change in the cpi to compute the inflation rate. plot the inflation rate from 1960 to 2013.(e) explain the difference between the ex-ante and ex-post real interest rate. use the fisher equation to compute the ex-post real interest rate. plot the nominal interest rate and the ex-post real interest rate from 1960 to 2013 in the same graph.
Answers: 3
Business, 22.06.2019 12:30
Amap from a trade development commission or chamber of commerce can be more useful than google maps for identifying
Answers: 1
Business, 22.06.2019 15:00
(a) what was the opportunity cost of non-gm food for many buyers before 2008? (b) why did they prefer the alternative? (c) what was the opportunity cost in 2008? (d) why did it change?
Answers: 2
You know the right answer?
Bond X is a premium bond making semiannual payments. The bond has a coupon rate of 8.4 percent, a YT...
Questions

Social Studies, 19.05.2021 16:50


English, 19.05.2021 16:50

Mathematics, 19.05.2021 16:50
Mathematics, 19.05.2021 16:50
Mathematics, 19.05.2021 16:50
Mathematics, 19.05.2021 16:50

Mathematics, 19.05.2021 16:50
History, 19.05.2021 16:50
Social Studies, 19.05.2021 16:50

Physics, 19.05.2021 16:50
Mathematics, 19.05.2021 16:50
Biology, 19.05.2021 16:50


