
Business, 10.03.2020 07:34 RainbowPieWasHere
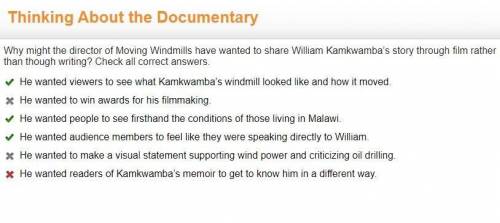
Why might the director of Moving Windmills have wanted to share William Kamkwamba’s story through film rather than though writing? Check all correct answers. He wanted viewers to see what Kamkwamba’s windmill looked like and how it moved. He wanted to win awards for his filmmaking. He wanted people to see firsthand the conditions of those living in Malawi. He wanted audience members to feel like they were speaking directly to William. He wanted to make a visual statement supporting wind power and criticizing oil drilling. He wanted readers of Kamkwamba’s memoir to get to know him in a different way.

Answers: 3
Another question on Business
Business, 22.06.2019 05:10
1. the political environment in india has proven to be critical to company performance for both pepsico and coca-cola india. what specific aspects of the political environment have played key roles? could these effects have been anticipated prior to market entry? if not, could developments in the political arena have been handled better by each company? 2. timing of entry into the indian market brought different results for pepsico and coca-cola india. what benefits or disadvantages accrued as a result of earlier or later market entry? 3. the indian market is enormous in terms of population and geography. how have the two companies responded to the sheer scale of operations in india in terms of product policies, promotional activities, pricing policies, and distribution arrangements? 4. “global localization” (glocalization) is a policy that both companies have implemented successfully. give examples for each company from the case.
Answers: 1
Business, 22.06.2019 19:50
Statistical process control charts: a. indicate to the operator the true quality of material leaving the process. b. display upper and lower limits for process variables or attributes and signal when a process is no longer in control. c. indicate to the process operator the average outgoing quality of each lot. d. display the measurements on every item being produced. e. are a graphic way of classifying problems by their level of importance, often referred to as the 80-20 rule.
Answers: 2
Business, 22.06.2019 22:20
David consumes two things: gasoline (q 1) and bread (q 2). david's utility function is u(q 1, q 2)equals70q 1 superscript 0.5 baseline q 2 superscript 0.5. let the price of gasoline be p 1, the price of bread be p 2, and income be y. derive david's demand curve for gasoline. david's demand for gasoline is q 1equals nothing. (properly format your expression using the tools in the palette. hover over tools to see keyboard shortcuts. e.g., a subscript can be created with the _ character.)
Answers: 1
Business, 22.06.2019 23:00
How is challah bread made? if i have to dabble the recipe?
Answers: 1
You know the right answer?
Why might the director of Moving Windmills have wanted to share William Kamkwamba’s story through fi...
Questions

Chemistry, 19.05.2021 23:00


Arts, 19.05.2021 23:00
English, 19.05.2021 23:00
Mathematics, 19.05.2021 23:00

Mathematics, 19.05.2021 23:00
Mathematics, 19.05.2021 23:00

Advanced Placement (AP), 19.05.2021 23:00
Mathematics, 19.05.2021 23:00


