
"Section 2: Supply and Demand Curves
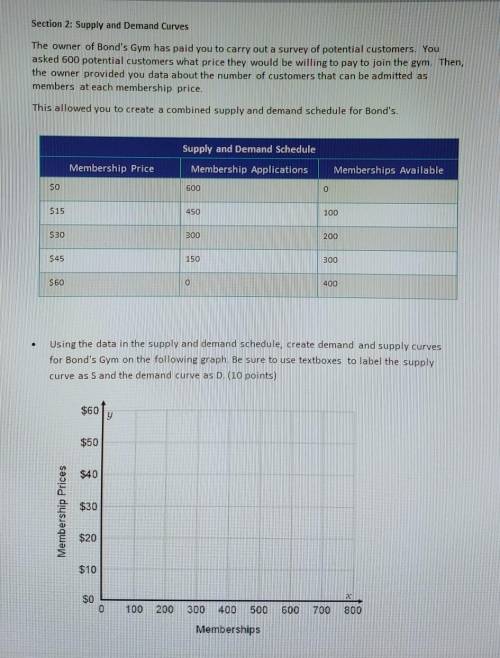
The owner of Bond's Gym has paid you to carry out a survey of potential customers. You asked 600 potential customers what price they would be willing to pay to join the gym. Then, the owner provided data about the number of customers that can be admitted as members at each membership price.
This allowed you to create a combined supply and demand schedule for Bond's.
(refer to the table shown in the picture)
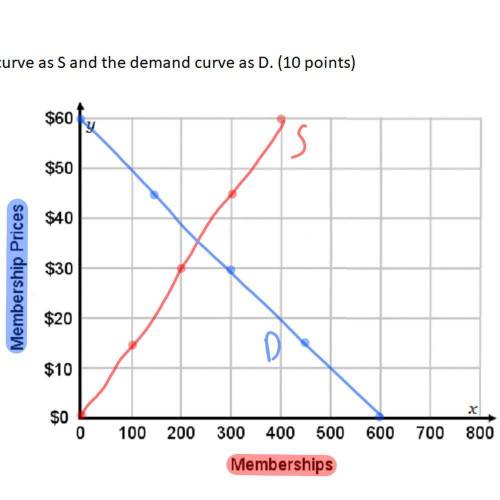
•Using the data in the supply and demand schedule, create demand and supply curves for Bond's Gym on the following graph. Be sure to use text boxes to label the supply curve as 'S' and the Demand curve as 'D'. (refer to the graph shown in the picture)"
if you couldn't read the photo, I wrote it all down here. I still don't have a grip on the graphing, so I'm kind of stuck. I'd really appreciate any help or explanation.

Answers: 1
Another question on Business
Business, 22.06.2019 09:40
Microsoft's stock price peaked at 6118% of its ipo price more than 13 years after the ipo suppose that $10,000 invested in microsoft at its ipo price had been worth $600,000 (6000% of the ipo price) after exactly 13 years. what interest rate, compounded annually, does this represent? (round your answer to two decimal places.)
Answers: 1
Business, 22.06.2019 11:20
You decided to charge $100 for your new computer game, but people are not buying it. what could you do to encourage people to buy your game?
Answers: 1
Business, 22.06.2019 11:30
Consider derek's budget information: materials to be used totals $64,750; direct labor totals $198,400; factory overhead totals $394,800; work in process inventory january 1, $189,100; and work in progress inventory on december 31, $197,600. what is the budgeted cost of goods manufactured for the year? a. $1,044,650 b. $649,450 c. $657,950 d. $197,600
Answers: 3
Business, 22.06.2019 14:20
In canada, the reference base period for the cpi is 2002. by 2012, prices had risen by 21.6 percent since the base period. the inflation rate in canada in 2013 was 1.1 percent. calculate the cpi in canada in 2013. hint: use the information that “prices had risen by 21.6 percent since the base period” to find the cpi in 2012. use the inflation rate formula (inflation is the growth rate of the cpi) to find cpi in 2013, knowing the cpi in 2012 and the inflation rate. the cpi in canada in 2013 is round up your answer to the first decimal. 122.9 130.7 119.6 110.5
Answers: 1
You know the right answer?
"Section 2: Supply and Demand Curves
The owner of Bond's Gym has paid you to carry out a survey of...
Questions

Chemistry, 16.04.2020 21:52

Mathematics, 16.04.2020 21:52

History, 16.04.2020 21:52


Biology, 16.04.2020 21:52
Business, 16.04.2020 21:52

Mathematics, 16.04.2020 21:52
Chemistry, 16.04.2020 21:52
Chemistry, 16.04.2020 21:52


Mathematics, 16.04.2020 21:52
Mathematics, 16.04.2020 21:52


