
As part of a major plant renovation project, the industrial engineering department has been asked to balance a revised assembly operation to achieve an output of 260 units per 8-hour day. Task times and precedence relationships are as follows:
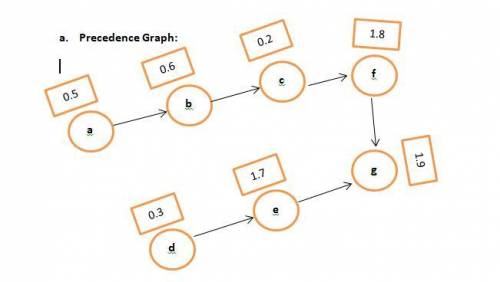
Task Duration (minutes) Immediate Predecessor
a 0.5 -
b 0.6 a
c 0.2 b
d 0.3 -
e 1.7 d
f 1.8 c
g 1.9 e, f
Do each of the following:
a. Draw the precedence diagram.
b. Determine the minimum cycle time, the maximum cycle time, and the calculated cycle time.
c. Determine the minimum number of stations needed.
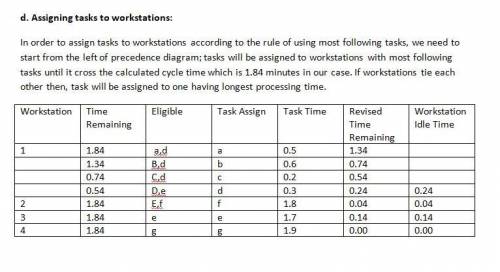
d. Assign tasks to workstations on the basis of greatest number of following tasks. Use longest processing time as a tiebreaker. If ties still exist, assume indifference in choice.
e. Compute the percentage of idle time for the assignment in part d.

Answers: 3
Another question on Business
Business, 22.06.2019 12:10
This exercise illustrates that poor quality can affect schedules and costs. a manufacturing process has 130 customer orders to fill. each order requires one component part that is purchased from a supplier. however, typically, 3% of the components are identified as defective, and the components can be assumed to be independent. (a) if the manufacturer stocks 130 components, what is the probability that the 130 orders can be filled without reordering components? (b) if the manufacturer stocks 132 components, what is the probability that the 130 orders can be filled without reordering components? (c) if the manufacturer stocks 135 components, what is the probability that the 130 orders can be filled without reordering components?
Answers: 3
Business, 22.06.2019 22:50
Total marketing effort is a term used to describe the critical decision factors that affect demand: price, advertising, distribution, and product quality. define the variable x to represent total marketing effort. a typical model that is used to predict demand as a function of total marketing effort is based on the power function: d = axb suppose that a is a positive number. different model forms result from varying the constant b. sketch the graphs of this model for b = 0, b = 1, 0< b< 1, b< 0, and b> 1. (we encourage you to use excel to do this.) what does each model tell you about the relationship between demand and marketing effort? what assumptions are implied? are they reasonable? how would you go about selecting the appropriate model?
Answers: 1
Business, 23.06.2019 05:10
Lakota is buying a new laptop. he wants to use google as his main search engine. he should be sure which internet browser(s) are loaded on his computer?
Answers: 2
Business, 23.06.2019 18:30
Carlos wrote a check for $44.92 to pay his gas bill. he’ll use the check register to record his transaction. what will be his new balance?
Answers: 1
You know the right answer?
As part of a major plant renovation project, the industrial engineering department has been asked to...
Questions

Mathematics, 10.12.2020 03:50

Mathematics, 10.12.2020 03:50

Mathematics, 10.12.2020 03:50


Mathematics, 10.12.2020 03:50
Spanish, 10.12.2020 03:50

Mathematics, 10.12.2020 03:50

History, 10.12.2020 03:50
Mathematics, 10.12.2020 03:50

Geography, 10.12.2020 03:50


