
Business, 12.01.2021 09:40 rosepotato789
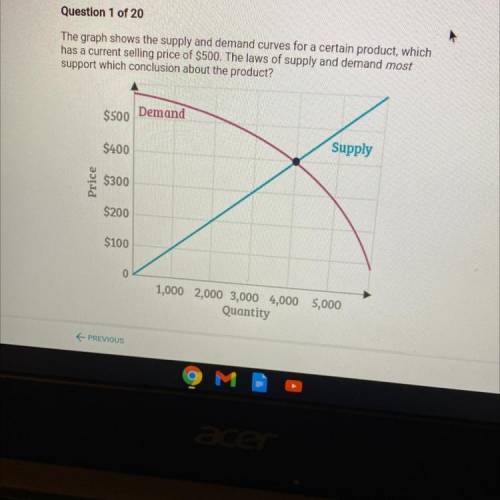
The graph shows the supply and demand curves for a certain product, which
has a current selling price of $500. The laws of supply and demand most
support which conclusion about the product?
$500
Demand
Supply
$400
Price
$300
$200
$100
0
1,000 2,000 3,000 4,000 5,000
Quantity

Answers: 3
Another question on Business
Business, 21.06.2019 17:40
Which of the following best explains cost-push inflation? a. increasing wages for workers drive up the cost of production, forcing producers to charge more to meet their costs. b. consumers demand goods faster than they can be supplied, increasing competition among buyers. c. rising prices for goods and services reduce spending power and cut into consumer demand. d. wages drop so that workers have to spend a higher percentage of income on the cost of necessities.2b2t
Answers: 1
Business, 21.06.2019 21:30
Recently, verizon wireless ran a pricing trial in order to estimate the elasticity of demand for its services. the manager selected three states that were representative of its entire service area and increased prices by 5 percent to customers in those areas. one week later, the number of customers enrolled in verizon's cellular plans declined 4 percent in those states, while enrollments in states where prices were not increased remained flat. the manager used this information to estimate the own-price elasticity of demand and, based on her findings, immediately increased prices in all market areas by 5 percent in an attempt to boost the company's 2016 annual revenues. one year later, the manager was perplexed because verizon's 2016 annual revenues were 10 percent lower than those in 2015"the price increase apparently led to a reduction in the company's revenues. did the manager make an error? yes - the one-week measures show demand is inelastic, so a price increase will decrease revenues. yes - the one-week measures show demand is elastic, so a price increase will reduce revenues. yes - cell phone elasticity is likely much larger in the long-run than the short-run. no - the cell phone market must have changed between 2011 and 2012 for this price increase to lower revenues.
Answers: 3
Business, 22.06.2019 11:00
Down under products, ltd., of australia has budgeted sales of its popular boomerang for the next four months as follows: unit salesapril 74,000may 85,000june 114,000july 92,000the company is now in the process of preparing a production budget for the second quarter. past experience has shown that end-of-month inventory levels must equal 10% of the following month’s unit sales. the inventory at the end of march was 7,400 units.required: prepare a production budget by month and in total, for the second quarter.
Answers: 3
Business, 22.06.2019 19:00
Describe how to write a main idea expressed as a bottom-line statement
Answers: 3
You know the right answer?
The graph shows the supply and demand curves for a certain product, which
has a current selling pri...
Questions


English, 03.02.2020 06:53
Social Studies, 03.02.2020 06:53

Mathematics, 03.02.2020 06:53

History, 03.02.2020 06:53
Mathematics, 03.02.2020 06:53

History, 03.02.2020 06:53

Advanced Placement (AP), 03.02.2020 06:53
Mathematics, 03.02.2020 06:53


