
Business, 23.03.2021 05:00 wickedskatboarder
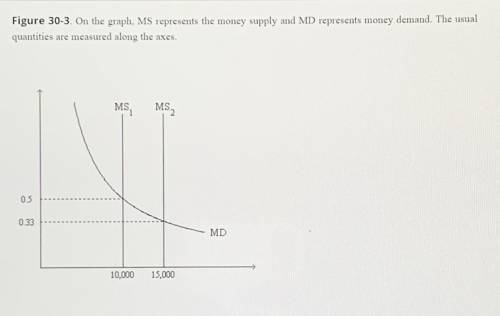
Refer to Figure 30-3. Which of the following events could explain a shift of the money-supply curve from
MS 1 to MS 2?
O a. an increase in the value of money
O b. a decrease in the price level
O C. an open-market purchase of bonds by the Federal Reserve
O d. the Federal Reserve sells bonds.

Answers: 1
Another question on Business
Business, 21.06.2019 23:20
Which feature transfers a slide show into a word-processing document?
Answers: 2
Business, 22.06.2019 03:30
Diversified semiconductors sells perishable electronic components. some must be shipped and stored in reusable protective containers. customers pay a deposit for each container received. the deposit is equal to the container’s cost. they receive a refund when the container is returned. during 2018, deposits collected on containers shipped were $856,000. deposits are forfeited if containers are not returned within 18 months. containers held by customers at january 1, 2018, represented deposits of $587,000. in 2018, $811,000 was refunded and deposits forfeited were $41,000. required: 1. prepare the appropriate journal entries for the deposits received and returned during 2018. 2. determine the liability for refundable deposits to be reported on the december 31, 2018, balance sheet.
Answers: 1
Business, 22.06.2019 08:00
Companies in the u.s. car rental market vary greatly in terms of the size of the fleet, the number of locations, and annual revenue. in 2011 hertz had 320,000 cars in service and annual revenue of approximately $4.2 billion. the following data show the number of cars in service (1000s) and the annual revenue ($ millions) for six smaller car rental companies (auto rental news website, august 7, 2012). excel file: data14-09.xls if required, enter negative values as negative numbers. a. select a scatter diagram with the number of cars in service as the independent variable. b. what does the scatter diagram developed in part (a) indicate about the relationship between the two variables? c. use the least squares method to develop the estimated regression equation (to 3 decimals). ŷ = + x d. for every additional car placed in service, estimate how much annual revenue will change. by $ e. fox rent a car has 11,000 cars in service. use the estimated regression equation developed in part (c) to predict annual revenue for fox rent a car. round your answer to nearest whole value. $ million hide feedback partially correct
Answers: 1
Business, 22.06.2019 21:50
Assume that (i) setups need to be completed first; (ii) a setup can only start once the batch has arrived at the resource, and (iii) all flow units of a batch need to be processed at a resource before any of the units of the batch can be moved to the next resource. process step 1 molding 2 painting 3 dressing setup time 15 min. 30 min. no setup processing time 0.25 min./unit 0.15 min./unit 0.30 min./unit which batch size would minimize inventory without decreasing the process capacity?
Answers: 1
You know the right answer?
Refer to Figure 30-3. Which of the following events could explain a shift of the money-supply curve...
Questions

Chemistry, 28.07.2019 01:00


English, 28.07.2019 01:00


Health, 28.07.2019 01:00
Mathematics, 28.07.2019 01:00
English, 28.07.2019 01:00
Mathematics, 28.07.2019 01:00


Social Studies, 28.07.2019 01:00
Mathematics, 28.07.2019 01:00
Business, 28.07.2019 01:00
Social Studies, 28.07.2019 01:00
Mathematics, 28.07.2019 01:00
Chemistry, 28.07.2019 01:00


