Question 5
II Pause
Q Zoom
Question 5
The graph shows the costs of producing ite...

Business, 21.04.2021 16:40 kaitietrueman8823
Question 5
II Pause
Q Zoom
Question 5
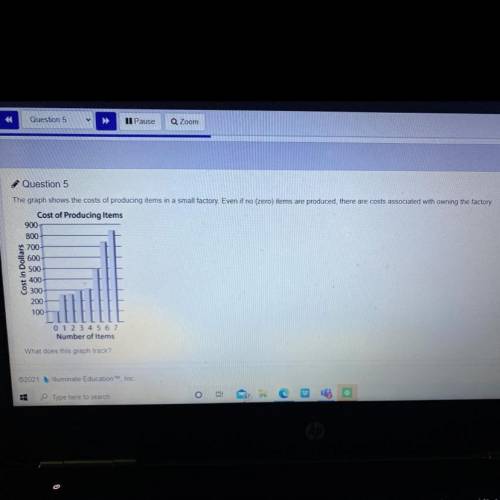
The graph shows the costs of producing items in a small factory. Even if no (zero) items are produced, there are costs associated with owning the factory
Cost of Producing Items
900
800
700
600
Cost in Dollars
400
300
200
100
0 1 2 3 4 5 6 7
Number of items
What does this graph track?
A-marginal cost , b- raw material cost, C- opportunity cost, D-fixed cost

Answers: 2
Another question on Business
Business, 22.06.2019 08:00
Interest is credited to a fixed annuity no lower than the variable contract rate contract guaranteed rate current rate of inflation prime rate
Answers: 2
Business, 22.06.2019 10:30
The card shoppe needs to maintain 21 percent of its sales in net working capital. currently, the store is considering a four-year project that will increase sales from its current level of $349,000 to $408,000 the first year and to $414,000 a year for the following three years of the project. what amount should be included in the project analysis for net working capital in year 4 of the project?
Answers: 3
You know the right answer?
Questions

Social Studies, 17.09.2021 14:10

Biology, 17.09.2021 14:10


Mathematics, 17.09.2021 14:10
Mathematics, 17.09.2021 14:10
Mathematics, 17.09.2021 14:10
English, 17.09.2021 14:10

Spanish, 17.09.2021 14:10

Chemistry, 17.09.2021 14:10
English, 17.09.2021 14:10
Mathematics, 17.09.2021 14:10


