
Chemistry, 28.02.2020 19:51 laurabwhiddon
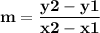
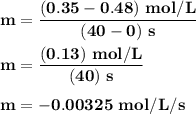
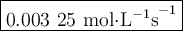
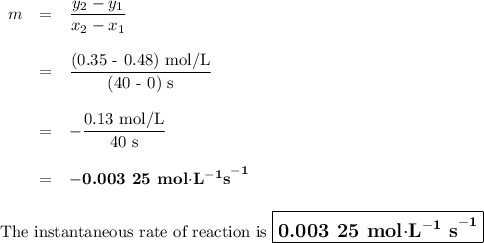
Time and concentration data were collected for the reaction A ⟶ products t (s) [A] (M) 0 0.52 20 0.43 40 0.34857 60 0.28538 80 0.23365 100 0.19130 The blue curve is the plot of the data. The straight orange line is tangent to the blue curve at t = 40 s. A plot has the concentration of A in molar on the y axis and time in seconds on the x axis. A curve contains the points (0, 0.52), (20, 0.43), (40, 0.35), (60, 0.29), (80, 0.24), and (100, 0.20). A line touches the curve at (40, 0.35) and has a y intercept of (0, 0.48). Approximate the instantaneous rate of this reaction at time t = 40 s.

Answers: 1
![Time and concentration data were collected for the reaction A ⟶ products t (s) [A] (M) 0 0.52 20 0.4](/tpl/images/0528/3101/b8cca.jpg)
![\begin{array}{rc}\textbf{t/s} & \textbf{[A]/mol$\cdot$L}^{\mathbf{-1}} \\0 & 0.52 \\20 & 0.43 \\40 & 0.35 \\60 & 0.29 \\80 & 0.24 \\100 & 0.20 \\\end{array}](/tpl/images/0528/3101/74b9f.png)
Another question on Chemistry
Chemistry, 21.06.2019 13:00
What type of reaction is represented by the following example? 2co2 (g) + 4h2o (l) + 1452 kj 2ch3oh (l) (g) + 3o2 (g) exothermic endothermic
Answers: 1
Chemistry, 22.06.2019 13:30
Mary is conducting an experiment on how pollution affects plant growth. how can she ensure that her data are reliable?
Answers: 3
Chemistry, 23.06.2019 03:30
Calculate the ph of a .10m nh4cl solution. the kb value for nh3 is 1.8×10^-5
Answers: 1
Chemistry, 23.06.2019 04:31
Which molecules are more strongly attracted to one another -c3h8o molecules that make up liquid rubbing alcohol or ch4 molecules that make up methane gas
Answers: 3
You know the right answer?
Time and concentration data were collected for the reaction A ⟶ products t (s) [A] (M) 0 0.52 20 0.4...
Questions

Mathematics, 29.08.2019 03:10
Mathematics, 29.08.2019 03:10
Mathematics, 29.08.2019 03:10

History, 29.08.2019 03:10

Social Studies, 29.08.2019 03:10

Mathematics, 29.08.2019 03:10
Mathematics, 29.08.2019 03:10
Mathematics, 29.08.2019 03:10

Computers and Technology, 29.08.2019 03:10


