Speed Graph
Time (s) Distance (m)
0
0
1
3
2
6
3
12<...

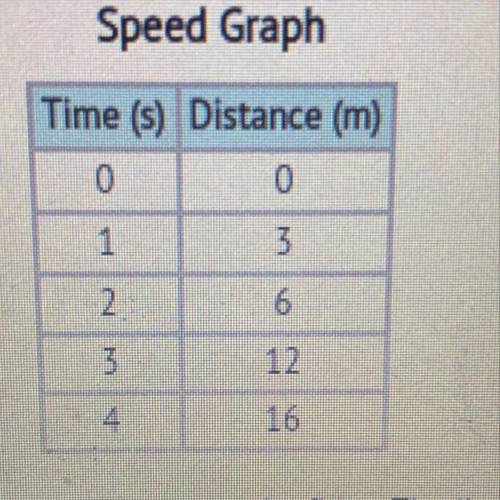
Speed Graph
Time (s) Distance (m)
0
0
1
3
2
6
3
12
4
16
Consider the data table charting the speed of a toy car moving across the floor. The line graph representing this data would BEST be
described as a
es -)
A)
curved line with varying slope.
B)
diagonal line with a slope of 3.
horizontal line with a slope of 3.
D)
diagonal line with varying slope, from 3 to 4

Answers: 1
Another question on Chemistry
Chemistry, 22.06.2019 10:10
Stage in which a typical star has completely stopped fusion
Answers: 1
Chemistry, 22.06.2019 11:30
Which statement best describes the flow of energy in this scenario
Answers: 1
Chemistry, 22.06.2019 22:20
How do cfcs cause ozone depletion? how do cfcs cause ozone depletion? ultraviolet radiation breaks down cfcs, molecules containing chlorine. chlorine then breaks one oxygen atom away from ozone, leaving behind a paired oxygen molecule. ultraviolet radiation breaks down cfcs, molecules containing chlorine. chlorine then breaks two oxygen atoms away from ozone, leaving behind a paired oxygen molecule. ultraviolet radiation creates cfcs, molecules containing chlorine. chlorine then breaks two oxygen atoms away from ozone, leaving behind a paired oxygen molecule. ultraviolet radiation creates cfcs, molecules containing chlorine. chlorine then breaks one oxygen atom away from ozone, leaving behind a paired oxygen molecule.
Answers: 2
Chemistry, 22.06.2019 22:30
The vapor pressure of ethanol is 1.00 × 10² mmhg at 34.90°c. what is its vapor pressure at 61.61°c? (δhvap for ethanol is 39.3 kj/mol.)
Answers: 2
You know the right answer?
Questions

English, 04.08.2021 14:00

Mathematics, 04.08.2021 14:00


Biology, 04.08.2021 14:00
Mathematics, 04.08.2021 14:00

Social Studies, 04.08.2021 14:00
Mathematics, 04.08.2021 14:00

World Languages, 04.08.2021 14:00
Mathematics, 04.08.2021 14:00
Mathematics, 04.08.2021 14:00
Chemistry, 04.08.2021 14:00
English, 04.08.2021 14:00
Mathematics, 04.08.2021 14:00
Social Studies, 04.08.2021 14:00


