HELP ASAP
solubility lab
can you please do a scatterplot graph with this information
gr...

Chemistry, 20.10.2020 03:01 bellrivera3434
HELP ASAP
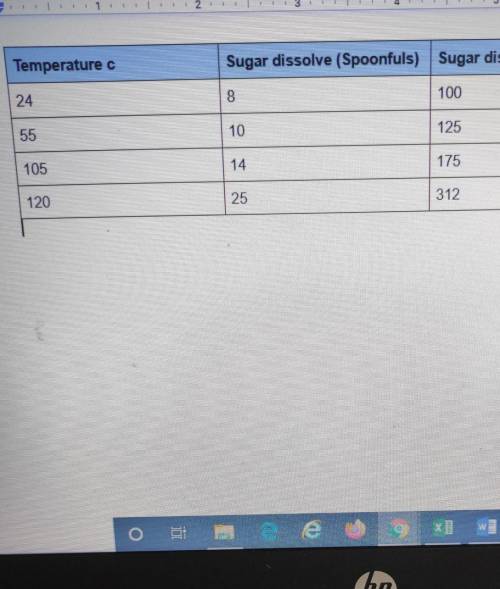
solubility lab
can you please do a scatterplot graph with this information
graph a scatterplot using x = temperature ( in degree Celsius and y=sugar dissolved (in grams). Each row will give one point for the graph. Analyza and interpret the scatterplot.

Answers: 3
Another question on Chemistry
Chemistry, 22.06.2019 10:00
A50.0g sample of liquid water at 0.0 c ends up as ice at -20.0 c. how much energy is involved in this change?
Answers: 1
Chemistry, 22.06.2019 11:00
Surface currents are caused by blank space . question 14 options: surface currents are caused by? differences in water temperature high salinity differences in density wind forces
Answers: 1
Chemistry, 23.06.2019 01:30
Astudent states that 9.0 g of baking soda will form an unsaturated solution in 100 g of water. what do you need to know to decide whether this statement is correct? a. the temperature of the water and the molar mass of baking soda b. the percent by volume of the solution and the solubility of baking soda c. the temperature of the water and the solubility of baking soda at that temperature
Answers: 1
You know the right answer?
Questions


Mathematics, 01.02.2021 22:00
Mathematics, 01.02.2021 22:00
Mathematics, 01.02.2021 22:00

Computers and Technology, 01.02.2021 22:00

Mathematics, 01.02.2021 22:00

Mathematics, 01.02.2021 22:00
Computers and Technology, 01.02.2021 22:00
Biology, 01.02.2021 22:00
Mathematics, 01.02.2021 22:00
Mathematics, 01.02.2021 22:00


