
Chemistry, 25.01.2021 04:20 masonorourke
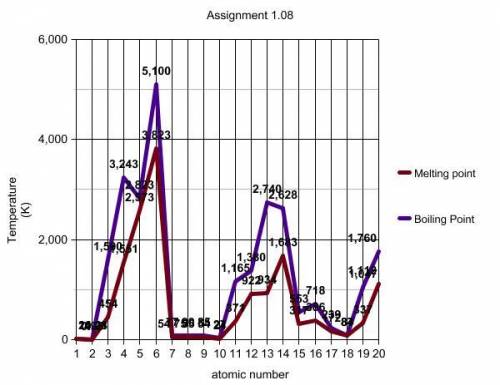
Now look at the segment of the graph between the two data points marked with black squares. Describe how the boiling point and melting point plots behave between these points. (look at the yellow line)
Question 2 options:
There is an increase in melting and boiling points between elements 3 and 7.
There is a decrease in melting and boiling points between elements 3 and 7.
There is no difference in the melting and boiling points between elements 3 and 7.
Question 3
periodic table
On your graph, the data points between the black squares are data for elements with atomic numbers 3 through 9. Locate these elements on your periodic table. What term or description would you use to identify these elements with respect to the periodic table?
Question 3 options:
The elements are in the same period.
The elements are in the same group.
Question 4
picture of graph
Now look at the green lines you created by connecting the three boiling point data points and the three melting point data points. For each of these lines, describe any trends you see.
Question 4 options:
The melting points increase slightly.
The melting points decrease slightly.
There is no change in the melting points.
Question 5
picture of periodic table
Locate the elements on your periodic table that you circled in green on your graph. What term or description would you use to identify these elements with respect to the periodic table?
Question 5 options:
The elements are in the same period.
The elements are in the same group or family.
Question 6
After reviewing your answers to questions 2 and 4 above, would you define boiling point and melting point as a periodic table family trend (vertical groups), period trend (horizontal rows), or neither? Explain your answer in the next question.
Question 6 options:
It is a family trend.
It is a period trend.
It is neither a period or family trend.
Question 7
After reviewing your answers to questions 2 and 4 above, would you define boiling point and melting point as a periodic table family trend (vertical groups), period trend (horizontal rows), or neither? Explain your answer here
Question 7 options:
Skip Toolbars for .
Format
Question 8
picture of graph
Using the room temperature line (orange line) and your periodic table, make lists that identify the state of matter (gas, liquid, or solid) in which each element you plotted exists at room temperature. Explain your answers.

Answers: 3
Another question on Chemistry
Chemistry, 22.06.2019 08:00
Match the mixture with the substance// i really need on this guys (it’s a pic btw)
Answers: 1
Chemistry, 22.06.2019 16:50
Answer asap need by wednesday morning explain how a buffer works, using an ethanoic acid/sodium ethanoate system including how the system resists changes in ph upon addition of a small amount of base and upon addition of a small amount of acid respectively. include the following calculations in your i. calculate the ph of a solution made by mixing 25cm3 0.1m ch3cooh and 40cm3 0.1m ch3coo-na+. [ka = 1.74 x 10⁻⁵ m] ii. calculate the ph following the addition of a 10cm3 portion of 0.08 m naoh to 500cm3 of this buffer solution. iii. calculate the ph following the addition of a 10cm3 portion of 0.08 m hcl to 200cm3 of the original buffer solution.
Answers: 1
Chemistry, 23.06.2019 05:00
1. true or false: minerals are inorganic. true false 2. inorganic means that something has never been found alive 3. halite is another name for and is a mineral with a cubic crystal pattern. table salt rock salt
Answers: 2
You know the right answer?
Now look at the segment of the graph between the two data points marked with black squares. Describe...
Questions


History, 11.09.2019 03:10
Chemistry, 11.09.2019 03:10

Mathematics, 11.09.2019 03:10
Mathematics, 11.09.2019 03:10


Computers and Technology, 11.09.2019 03:20


