
Chemistry, 25.01.2021 04:30 bartonamber4042
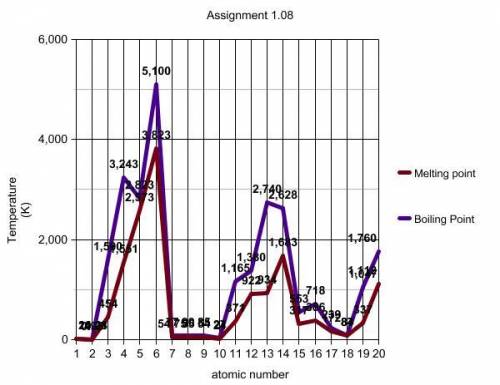
Looking at the line plots on your graph, describe how boiling point and melting point vary with respect to atomic number. Please answer using a complete sentence.
Question 1 options:
Question 2
picture of graph
Now look at the segment of the graph between the two data points marked with black squares. Describe how the boiling point and melting point plots behave between these points. (look at the yellow line)
Question 2 options:
There is an increase in melting and boiling points between elements 3 and 7.
There is a decrease in melting and boiling points between elements 3 and 7.
There is no difference in the melting and boiling points between elements 3 and 7.
Question 3
periodic table
On your graph, the data points between the black squares are data for elements with atomic numbers 3 through 9. Locate these elements on your periodic table. What term or description would you use to identify these elements with respect to the periodic table?
Question 3 options:
The elements are in the same period.
The elements are in the same group.
Question 4
picture of graph
Now look at the green lines you created by connecting the three boiling point data points and the three melting point data points. For each of these lines, describe any trends you see.
Question 4 options:
The melting points increase slightly.
The melting points decrease slightly.
There is no change in the melting points.
Question 5
picture of periodic table
Locate the elements on your periodic table that you circled in green on your graph. What term or description would you use to identify these elements with respect to the periodic table?
Question 5 options:
The elements are in the same period.
The elements are in the same group or family.
Question 6
After reviewing your answers to questions 2 and 4 above, would you define boiling point and melting point as a periodic table family trend (vertical groups), period trend (horizontal rows), or neither? Explain your answer in the next question.
Question 6 options:
It is a family trend.
It is a period trend.
It is neither a period or family trend.
Question 7
After reviewing your answers to questions 2 and 4 above, would you define boiling point and melting point as a periodic table family trend (vertical groups), period trend (horizontal rows), or neither? Explain your answer here
Question 7 options:
Skip Toolbars for .
Format
Question 8
picture of graph
Using the room temperature line (orange line) and your periodic table, make lists that identify the state of matter (gas, liquid, or solid) in which each element you plotted exists at room temperature. Explain your answers.

Answers: 3
Another question on Chemistry
Chemistry, 22.06.2019 18:50
At stp, which substance is the best conductor of electricity? a. nitrogen b. neon c. sulfur d. silver
Answers: 1
Chemistry, 23.06.2019 02:00
What causes the appearance of lines in a emission spectrum
Answers: 1
Chemistry, 23.06.2019 02:20
In a chemical reaction, the final amount of the products is determined by the a. universal gas law b. law of definite proportions c. air pressure d. temperature e. none of the above me
Answers: 2
You know the right answer?
Looking at the line plots on your graph, describe how boiling point and melting point vary with resp...
Questions

Mathematics, 13.09.2020 17:01
Mathematics, 13.09.2020 17:01
Mathematics, 13.09.2020 17:01
Mathematics, 13.09.2020 17:01

Geography, 13.09.2020 17:01
Mathematics, 13.09.2020 17:01
Mathematics, 13.09.2020 17:01
Mathematics, 13.09.2020 17:01
Mathematics, 13.09.2020 17:01
Mathematics, 13.09.2020 17:01
Mathematics, 13.09.2020 17:01
Mathematics, 13.09.2020 17:01
Mathematics, 13.09.2020 17:01
Mathematics, 13.09.2020 17:01
Mathematics, 13.09.2020 17:01
Mathematics, 13.09.2020 17:01
Mathematics, 13.09.2020 17:01
Mathematics, 13.09.2020 17:01
Mathematics, 13.09.2020 17:01
Mathematics, 13.09.2020 17:01


