The graph shows how milk production from a herd of cows has changed.
a
8
7
mean g...

Chemistry, 08.02.2021 18:40 blossie94681
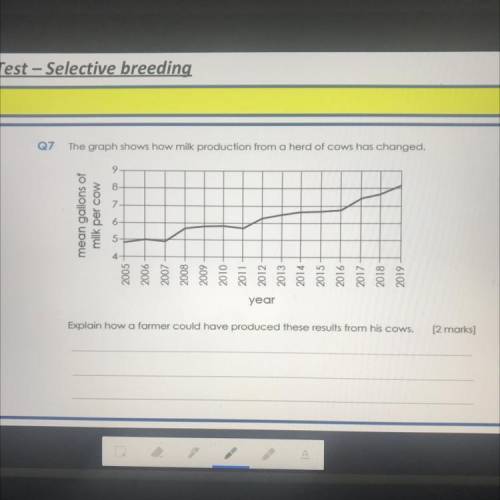
The graph shows how milk production from a herd of cows has changed.
a
8
7
mean gallons of
per cow
milk
6
5
4
2005
9007
2007
2008
2009
2010
2011
2012
2013
2014
2015
2016
2017
2018
2019
year
Explain how a farmer could have produced these results from his cows.

Answers: 1
Another question on Chemistry
Chemistry, 21.06.2019 22:40
How many electrons does silver have to give up in order to achieve a sido noble gas electron configuration
Answers: 1
Chemistry, 22.06.2019 02:00
In the following redox reaction which is the oxidizing agent and which is the reducing agent? alcl3 + na nacl + al
Answers: 1
You know the right answer?
Questions


Mathematics, 08.12.2020 22:00
Mathematics, 08.12.2020 22:00

Medicine, 08.12.2020 22:00

History, 08.12.2020 22:00
Mathematics, 08.12.2020 22:00

Social Studies, 08.12.2020 22:00
Mathematics, 08.12.2020 22:00

Mathematics, 08.12.2020 22:00
Mathematics, 08.12.2020 22:00


