
Chemistry, 06.12.2021 04:30 flowersthomas1969
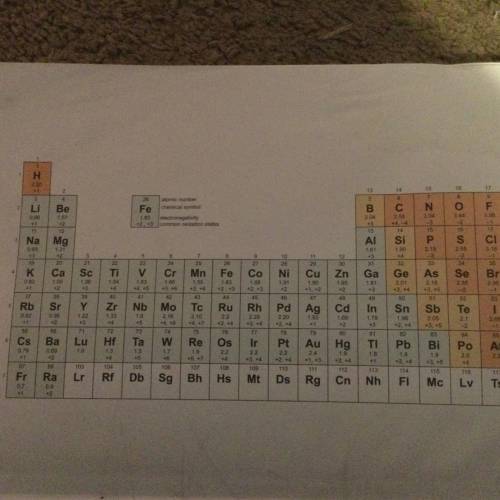
Referring to the chart of electronegativity values (see pic), determine the approximate value of the percent ionic character for the following bonds, and identify the bond as ionic, polar covalent, or no polar covalent.
a. I-I
b. K-Cl
c. Ca-O

Answers: 3
Another question on Chemistry
Chemistry, 22.06.2019 03:30
Melting and boiling are endothermic processes. this means that these processes absorb energy from their surroundings in order to occur. use this information and the data you collected in the phase change gizmo to describe what happens to the temperature of water when you boil it, then explain why this result occurs.
Answers: 2
Chemistry, 22.06.2019 04:00
Two nitro no2 groups are chemically bonded to a patch of surface. they can't move to another location on the surface, but they can rotate (see sketch at right). it turns out that the amount of rotational kinetic energy each no2 group can have is required to be a multiple of ε, where =ε×1.010−24 j. in other words, each no2 group could have ε of rotational kinetic energy, or 2ε, or 3ε, and so forth — but it cannot have just any old amount of rotational kinetic energy. suppose the total rotational kinetic energy in this system is initially known to be 32ε. then, some heat is removed from the system, and the total rotational kinetic energy falls to 18ε. calculate the change in entropy. round your answer to 3 significant digits, and be sure it has the correct unit symbol.
Answers: 2
Chemistry, 22.06.2019 05:50
Astudent made a graph plotting the progress of a reaction over time. the student forgot to label the y-axis of the graph. a graph is shown with two graph lines. one graph line starts at a higher position on the y axis and slopes downwards towards the right. the other graph line starts at a lower position on the y axis and slopes upwards towards the right. the two graph lines stop short of intersecting each other and continue as separate lines which gradually become straight and parallel to the x axis. a vertical line is shown at a point where the two graph lines finally became parallel to the x axis. this vertical line is labeled equilibrium. the title on the x axis is time and an arrow pointing towards the right is shown above time. the title on the y axis is left blank. what best explains the label that the student should use on the y-axis? amount, because as the amount of product decreases, the amount of reactant increases over time. reaction rate, because forward and backward reaction become equal at equilibrium. amount, because the amounts of reactants and products become constant after equilibrium is reached. reaction rate, as the rate of forward reaction increases and rate of backward reaction decreases over time.
Answers: 3
Chemistry, 22.06.2019 23:00
What is the measured amount of a product obtained from a chemical reaction?
Answers: 1
You know the right answer?
Referring to the chart of electronegativity values (see pic), determine the approximate value of the...
Questions

Mathematics, 11.09.2020 01:01
Mathematics, 11.09.2020 01:01

English, 11.09.2020 01:01
Mathematics, 11.09.2020 01:01
Mathematics, 11.09.2020 01:01
Mathematics, 11.09.2020 01:01
Mathematics, 11.09.2020 01:01

Social Studies, 11.09.2020 01:01

Biology, 11.09.2020 01:01
Mathematics, 11.09.2020 01:01
Mathematics, 11.09.2020 01:01
Mathematics, 11.09.2020 01:01
Mathematics, 11.09.2020 01:01
Mathematics, 11.09.2020 01:01
Mathematics, 11.09.2020 01:01
Mathematics, 11.09.2020 01:01
Mathematics, 11.09.2020 01:01
Mathematics, 11.09.2020 01:01
Mathematics, 11.09.2020 01:01
Mathematics, 11.09.2020 01:01


