
Geography, 09.10.2019 19:10 edfwef5024
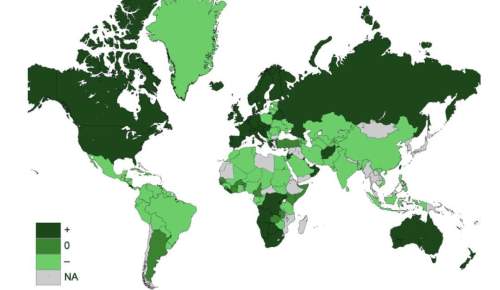
The following map shows net migration rates throughout the world in 2008. why are the net migrations positive in western europe and negative in eastern europe?
political map showing net migration rates throughout the world in 2008. colors show the migration rates in countries. orange countries have a negative rate, green have a zero rate, and blue have a positive rate. the united states and western europe are primarily blue.
a. forced migration in eastern europe
b. higher wages in western europe
c. more factories and industry in western europe
d. better education and cultural opportunities in western europe

Answers: 1
Another question on Geography
Geography, 24.06.2019 02:00
Some of the incoming solar radiation is absorbed by the floor. identify the type of electromagnetic energy reradiated by the floor
Answers: 2
Geography, 24.06.2019 09:00
With these question would be nice i needs them in a hurry which nation leads eastern europe in nuclear energy usage? a ukraine b lithuania c slovakia d solvenia which eastern european nation is popular with skiers? a czech republic b estonia c bulgaria d none are
Answers: 1
Geography, 24.06.2019 11:20
What ocean lies to the north of both asia and north america
Answers: 2
You know the right answer?
The following map shows net migration rates throughout the world in 2008. why are the net migrations...
Questions


Biology, 30.07.2019 05:30


English, 30.07.2019 05:30
History, 30.07.2019 05:30

Biology, 30.07.2019 05:30
History, 30.07.2019 05:30

Mathematics, 30.07.2019 05:30
English, 30.07.2019 05:30


