
Geography, 12.03.2021 03:50 janeou17xn
20 POINTS
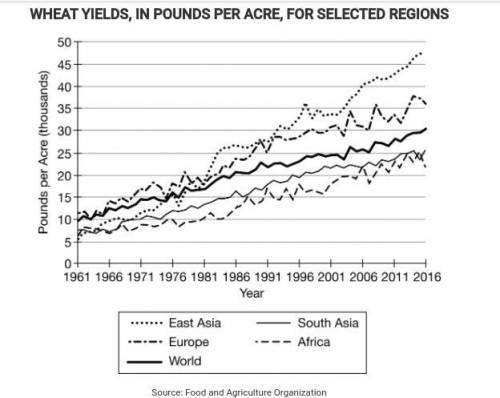
The graph shows regional and global trends in wheat farming since 1961. In this graph, the amount of wheat is measured in pounds per acre of farmland.
A. Using data on the graph, compare the wheat production trend lines of East Asia and Africa from 1961 to 1971.
B. Explain how pesticides and irrigation pumps had an effect on wheat farms in East Asia.
C. Explain why the Green Revolution had different impacts on farming in African countries compared to South Asian countries.
D. Using ONE region on the graph, explain the relationship between changes in wheat farming practices and the amount of rural-to-urban migration.

Answers: 3
Another question on Geography
Geography, 22.06.2019 20:20
Why the moon is not visible from earth during the new moon ?
Answers: 1
Geography, 22.06.2019 22:30
The map above shows where people live in the united states. areas that are darker blue are areas where people live close together. areas that are lighter colors are places where people live farther apart. as a geographer, if you were to study where people live and why they choose to live in these places, which of the six essential elements of geography would you be using?
Answers: 1
Geography, 23.06.2019 08:50
Which of the following is true of all geographic locations on earth?
Answers: 3
You know the right answer?
20 POINTS
The graph shows regional and global trends in wheat farming since 1961. In this graph, th...
Questions

Mathematics, 16.01.2020 23:31
Mathematics, 16.01.2020 23:31
Mathematics, 16.01.2020 23:31


Physics, 16.01.2020 23:31


Biology, 16.01.2020 23:31
Mathematics, 16.01.2020 23:31


