Look at the circle graph.
US Incomes, 1890
A circle graph titled U S Incomes...

History, 25.04.2020 18:15 thanitoast84
Look at the circle graph.
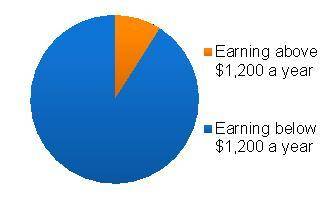
US Incomes, 1890
A circle graph titled U S Incomes, 1890. About one-tenth of the pie is shaded orange and labeled Earning above 1,200 dollars a year. The rest of the pie is labeled Earning below 1,200 dollars a year.
What does the graph tell you about the balance of income during the late 1800s?
a) Most people did not earn more than $1,200 in a year.
b) Most people earned enough money to support their families.
c) Most people earned about the same amount of money.
d) Most people were factory or company owners.

Answers: 1
Another question on History
History, 22.06.2019 00:00
What refers to the division of power among the three branches of government
Answers: 1
History, 22.06.2019 02:30
Pl ! the term laissez-faire refers to the government’s approach, in the 1890s, to foreign policy affecting trade. economic policy affecting business. educational policy affecting schools. domestic policy affecting social reform.
Answers: 1
History, 22.06.2019 04:00
Explain when conformity is beneficial and when it is harmful. give examples of both?
Answers: 1
History, 22.06.2019 05:30
Which of the best following describes william jennings bryan’s learning experience
Answers: 2
You know the right answer?
Questions

Mathematics, 14.10.2019 07:10

Chemistry, 14.10.2019 07:10
Mathematics, 14.10.2019 07:10

Biology, 14.10.2019 07:10

English, 14.10.2019 07:10
Biology, 14.10.2019 07:10

Business, 14.10.2019 07:10
Mathematics, 14.10.2019 07:10
English, 14.10.2019 07:10
Mathematics, 14.10.2019 07:10


