
Review the graph.
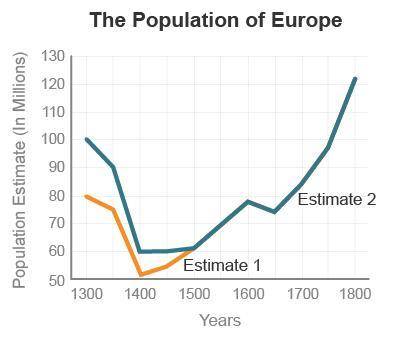
A line graph titled The Population of Europe. The x-axis is labeled Years (1300 to 1800). The y-axis is labeled Population Estimate (in Millions). Estimate 1: 1300, 80 million; 1400, 50 million; 1500, 60 million. Estimate 2: 1300, 100 million, 1400, 60 million; 1500, 63 million; 1600, 75 million, 1700, 85 million; 1800, over 120 million.
According to both estimates, how long did it take Europe’s population to begin to rebuild after the plague?
at least one hundred years
less than one hundred years
more than three hundred years
more than five hundred years

Answers: 1
Another question on History
History, 21.06.2019 20:40
In what year did vladimir lenin and the bolsheviks seize power in russia? 1885 1900 1917 1961
Answers: 3
History, 22.06.2019 02:30
What is significant about the power that russian federal cities are granted?
Answers: 1
History, 22.06.2019 10:00
Which of these is not a purpose of the constitution as explained in the preamble? • to make a better country • to keep states more powerful the the u.s. • to keep peace in the country • to protect freedom
Answers: 1
History, 22.06.2019 11:00
How did louis sullivan and william jenney change the face of american cities in the late 1800s
Answers: 1
You know the right answer?
Review the graph.
A line graph titled The Population of Europe. The x-axis is labeled Years (1300 t...
Questions

Mathematics, 06.01.2021 22:50

English, 06.01.2021 22:50


Mathematics, 06.01.2021 23:00
Mathematics, 06.01.2021 23:00

Social Studies, 06.01.2021 23:00
Mathematics, 06.01.2021 23:00

Chemistry, 06.01.2021 23:00
Mathematics, 06.01.2021 23:00
Mathematics, 06.01.2021 23:00
Mathematics, 06.01.2021 23:00
Mathematics, 06.01.2021 23:00
Mathematics, 06.01.2021 23:00


