
History, 23.03.2021 02:10 sclifton2014
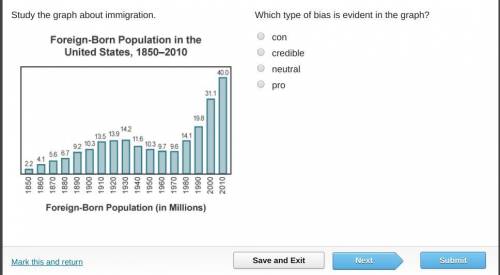
Study the graph about immigration.
A bar graph titled Foreign-Born Population in the United States from 1850 to 2010. The x-axis is labeled Foreign-Born Population in millions from years 1850 to 2010. 1850 is 2.2. 1890 is 9.2. 1920 is 13.9. 1930 is 14.2. 1950 is 10.3. 1990 is 19.8. 2010 is 40.
Which type of bias is evident in the graph?
con
credible
neutral
pro

Answers: 1
Another question on History
History, 21.06.2019 20:50
Match the leaders with their goals at the yalta conference of 1945. franklin roosevelt winston churchill joseph stalin wanted to prevent future threats from germany wanted free elections in eastern europe wanted soviet against japan
Answers: 2
History, 21.06.2019 23:30
How was george washington able to defeat the british in the battle of trenton and princeton
Answers: 2
History, 22.06.2019 04:30
The had established a temporary government only 3 days earlier
Answers: 1
History, 22.06.2019 12:30
Even though the u.s. was not at war roosevelt met with great britain to sign this secret pact that neither country would seek territorial gains after the war. a atlantic charter c. potsdam charter b. yalta charter d. london charter
Answers: 2
You know the right answer?
Study the graph about immigration.
A bar graph titled Foreign-Born Population in the United States...
Questions
History, 27.01.2021 01:30

Mathematics, 27.01.2021 01:30

Mathematics, 27.01.2021 01:30
Mathematics, 27.01.2021 01:30

Geography, 27.01.2021 01:30


Arts, 27.01.2021 01:30
Mathematics, 27.01.2021 01:30
English, 27.01.2021 01:30
Geography, 27.01.2021 01:30

Mathematics, 27.01.2021 01:30


