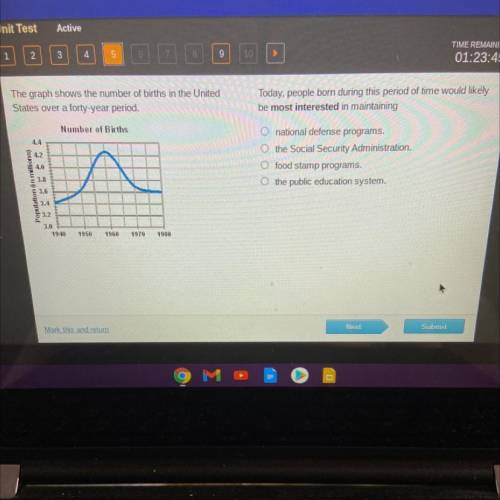
The graph shows the number of births in the United
States over a forty-year period.
Today, p...

History, 27.04.2021 21:20 janneemanoeee
The graph shows the number of births in the United
States over a forty-year period.
Today, people born during this period of time would likely
be most interested in maintaining
Number of Births
4.4
4.2
O national defense programs.
O the Social Security Administration.
O food stamp programs.
o the public education system.
4.0
Population in millions)
3.8
3.6
3.4
3.2
3.0
1940
1950
1960
1970
1980


Answers: 3
Another question on History

History, 22.06.2019 01:00
“i now wished for the last friend,death, to relieve me.” what is equiano referring to?
Answers: 2

History, 22.06.2019 03:30
What is the best possible explanation for why the first ghosts seen were flaming spirits with their bodies on fire
Answers: 1

History, 22.06.2019 06:20
How did the writing of the constitution demonstrate the political process? definition of political process by merriam webster: the process of the formulation and administration of public policy usually by interaction between social groups and political institutions or between political leadership and public opinion.
Answers: 2

History, 22.06.2019 07:00
What are the purposes of a political cartoon? check all that apply.
Answers: 1
You know the right answer?
Questions

Mathematics, 19.12.2019 19:31


Mathematics, 19.12.2019 19:31

Mathematics, 19.12.2019 19:31


Mathematics, 19.12.2019 19:31


English, 19.12.2019 19:31


Mathematics, 19.12.2019 19:31

Chemistry, 19.12.2019 19:31


