
Mathematics, 18.07.2019 05:30 Homepage10
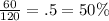
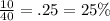
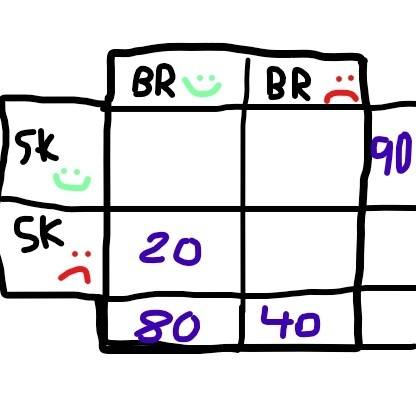
(06.05 mc) a group of students were surveyed to find out if they like bike riding and/or roller skating as a hobby. the results of the survey are shown below: 80 students like bike riding 20 students like bike riding but do not like skating 90 students like skating 40 students do not like bike riding make a two-way table to represent the data and use the table to answer the following questions. part a: what percentage of the total students surveyed like both bike riding and skating? show your work. (5 points) part b: what is the probability that a student who does not like bike riding also does not like skating? explain your answer. (5 points)

Answers: 2
Another question on Mathematics
Mathematics, 21.06.2019 18:30
The base of a triangle exceeds the height by 9 inches. if the area is 180 square inches, find the length of the base and the height of the triangle.
Answers: 1
Mathematics, 21.06.2019 20:30
1. evaluate 8x(2)y9(-2) for x=-1 and y=2 2. simplify the equation. -() 3. simplify the expression. [tex]\frac{5}{x(-2) y9(5)}[/tex]
Answers: 1
Mathematics, 21.06.2019 21:30
Over the course of the school year, you keep track of how much snow falls on a given day and whether it was a snow day. your data indicates that of twenty-one days with less than three inches of snow, five were snow days, while of the eight days with more than three inches of snow, six were snow days. if all you know about a day is that it is snowing, what is the probability that it will be a snow day?
Answers: 1
You know the right answer?
(06.05 mc) a group of students were surveyed to find out if they like bike riding and/or roller skat...
Questions


Law, 06.04.2021 20:40

Mathematics, 06.04.2021 20:40
Engineering, 06.04.2021 20:40

English, 06.04.2021 20:40
Mathematics, 06.04.2021 20:40

Biology, 06.04.2021 20:40
Mathematics, 06.04.2021 20:40
Mathematics, 06.04.2021 20:40
Mathematics, 06.04.2021 20:40
Mathematics, 06.04.2021 20:40
Mathematics, 06.04.2021 20:40


