
Mathematics, 01.01.2020 04:31 tragesserj
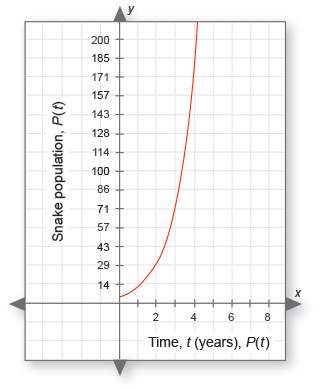
Below is the graph of the boa constrictor population. the x-axis is t, the time in years, and the y-axis is p(t), the snake population for any given year. in this case, t = 0 indicates the year they started keeping track of the boa population. scientists want to know how the snake population is changing every two years so they can make predictions about the next two years.
students' conjectures:
two students, sarah and ernest, agree that the graph is exponential but disagree on how the rate changes between successive time periods.
1. complete the table below to summarize each classmate's conjecture. (2 points: 1 point for each row of the chart)
classmate conjecture
ernest
sarah
2. using your knowledge of exponential functions, who do you think is correct? (1 point)
analyzing the data:
3. is this graph increasing or decreasing? does this imply that the boa constrictor population is growing or diminishing? (1 point)
4. looking at this graph, would you agree that the boa constrictor population could be a problem? (1 point)
5. what is the horizontal asymptote of this graph? (1 point)
6. what is the range? explain. (1 point)
7. what is the y-intercept? what does this mean in terms of the snake population? (1 point)
here is the function for this graph, where t is the time in years: p(t) = 5e0.89t.
8. use this formula to estimate the boa constrictor population in 2 years, 4 years, and 6 years. (6 points: 2 points for each year, including 1 point for showing your work and 1 point for the answer)
t: time in years p(t): estimated snake population at time t
2
4
6
9. find the rate of change for the snake population from year 0 to year 2. (2 points)
10. apply the rate of change you found in question 9 in order to estimate the snake population for year 4. how does your answer compare with the calculated value? (1 point)
11. if there are approximately 36,660 snakes (rounded to the nearest 10) in year 10, how many will there be in year 12? (1 point)
making a decision:
12. given your calculations above, is ernest's or sarah's conjecture correct? (2 points)

Answers: 3
Another question on Mathematics
Mathematics, 21.06.2019 16:00
Ernest is purchasing a $175,000 home with a 30-year mortgage. he will make a $15,000 down payment. use the table below to find his monthly pmi payment.
Answers: 2
Mathematics, 21.06.2019 18:20
What is the solution set of the quadratic inequality x^2-5< or equal to 0
Answers: 1
Mathematics, 21.06.2019 20:20
Consider the following estimates from the early 2010s of shares of income to each group. country poorest 40% next 30% richest 30% bolivia 10 25 65 chile 10 20 70 uruguay 20 30 50 1.) using the 4-point curved line drawing tool, plot the lorenz curve for bolivia. properly label your curve. 2.) using the 4-point curved line drawing tool, plot the lorenz curve for uruguay. properly label your curve.
Answers: 2
You know the right answer?
Below is the graph of the boa constrictor population. the x-axis is t, the time in years, and the y-...
Questions


Mathematics, 28.04.2021 01:00

Mathematics, 28.04.2021 01:00

Chemistry, 28.04.2021 01:00

English, 28.04.2021 01:00
English, 28.04.2021 01:00
History, 28.04.2021 01:00
Mathematics, 28.04.2021 01:00
Physics, 28.04.2021 01:00

French, 28.04.2021 01:00

Arts, 28.04.2021 01:00
Chemistry, 28.04.2021 01:00


