
Mathematics, 21.11.2019 04:31 jumpgirll
Ineed math ! i don't understand this assignment at all! it has 5 parts, the first four are charts or graphs i have to fill out and the last one is written reflection of the first four. i'll insert pictures.
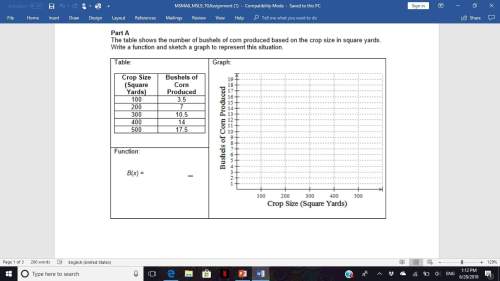
part a
the table shows the number of bushels of corn produced based on the crop size in square yards. write a function and sketch a graph to represent this situation. (see 1st picture) - just tell me what to write for the function, and the coordinates for the sketch
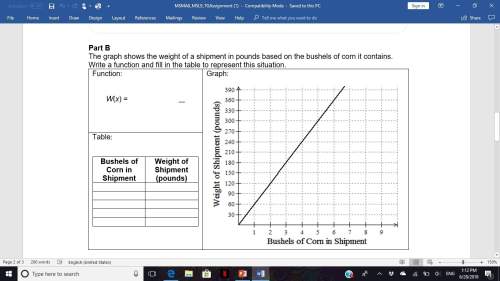
part b
the graph shows the weight of a shipment in pounds based on the bushels of corn it contains.
write a function and fill in the table to represent this situation. (see 2nd picture) - tell me what to write in the table, and what to write for the function
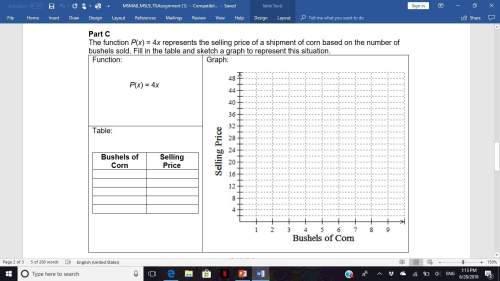
part c
the function p(x) = 4x represents the selling price of a shipment of corn based on the number of bushels sold. fill in the table and sketch a graph to represent this situation. (see 3rd picture) - tell me what to write in the table, and the coordinates for the sketch on the graph
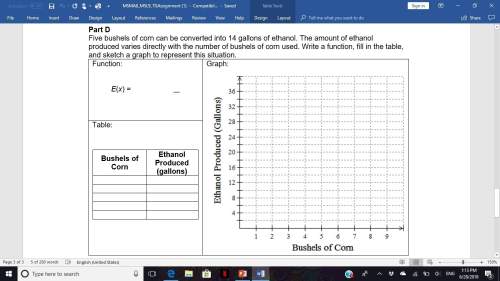
part d
five bushels of corn can be converted into 14 gallons of ethanol. the amount of ethanol produced varies directly with the number of bushels of corn used. write a function, fill in the table, and sketch a graph to represent this situation. (see 4th picture) - this one's really confusing, tell me the function, what to put in the tale, and the coordinates for the sketch on the graph
part e
look back at all of these examples of direct linear variation which are proportional relationships. what common characteristics do they have to distinguish them from non-proportional relationships? what distinguishes their equations from non-proportional relationships?
if you do , you. if you can't , don't answer anything. answers only . late answers welcome, because better late than never.
||45 points||

Answers: 2
Another question on Mathematics
Mathematics, 21.06.2019 19:30
The length of a shadow of the building is 36m. the length of the pole, which is perpendicular to the ground, is 1.9m. the length of the pole's shadow is 1.52m. what is the height of the building?
Answers: 1
Mathematics, 21.06.2019 21:10
Hey free points ! people i have a few math questions on my profile consider looking at them i have to get done in 30 mins!
Answers: 1
Mathematics, 21.06.2019 22:30
According to the 2008 u.s. census, california had a population of approximately 4 × 10^7 people and florida had a population of approximately 2 × 10^7 people. which of the following is true? a. the population of california was approximately two times the population of florida. b. the population of florida was approximately twenty times the population of california. c. the population of florida was approximately two times the population of california. d. the population of california was approximately twenty times the population of florida.
Answers: 1
You know the right answer?
Ineed math ! i don't understand this assignment at all! it has 5 parts, the first four are charts...
Questions
Mathematics, 31.08.2019 22:50

Mathematics, 31.08.2019 22:50

Mathematics, 31.08.2019 22:50

History, 31.08.2019 22:50

Geography, 31.08.2019 22:50

Business, 31.08.2019 22:50
Biology, 31.08.2019 22:50
Mathematics, 31.08.2019 22:50


