
Mathematics, 12.07.2019 22:30 ljcervantes4824
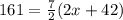
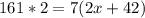
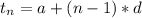
On thursday carissa ate some cranberries. the next day she couldn't stop thinking about how good the cranberries were and ate seven more cranberries than she had eaten on thursday. each day after that she ate seven more cranberries than the day before. by the following wednesday night, she had eaten a total of 161 cranberries for the whole week. how many cranberries did carissa eat on thursday? extra: since carissa would probably get sick eating so many cranberries, let's pretend. if she were to continue this pattern, each day eating seven more cranberries than the day before, on which day would she eat 499 cranberries for her daily total?

Answers: 1


Another question on Mathematics
Mathematics, 21.06.2019 23:30
If the car had not hit the fence, how much farther would it have skidded? solve the skid-distance formula to find the extra distance that the car would have traveled if it had not hit the fence. round your answer to two decimal places. note that unit conversion is built into the skid distance formula, so no unit conversions are needed.
Answers: 2
Mathematics, 22.06.2019 01:00
Y= x – 6 x = –4 what is the solution to the system of equations? (–8, –4) (–4, –8) (–4, 4) (4, –4)
Answers: 1
Mathematics, 22.06.2019 02:00
1. the manager of collins import autos believes the number of cars sold in a day (q) depends on two factors: (1) the number of hours the dealership is open (h) and (2) the number of salespersons working that day (s). after collecting data for two months (53 days), the manager estimates the following log-linear model: q 4 equation 1 a. explain, how to transform the log-linear model into linear form that can be estimated using multiple regression analysis. the computer output for the multiple regression analysis is shown below: q4 table b. how do you interpret coefficients b and c? if the dealership increases the number of salespersons by 20%, what will be the percentage increase in daily sales? c. test the overall model for statistical significance at the 5% significance level. d. what percent of the total variation in daily auto sales is explained by this equation? what could you suggest to increase this percentage? e. test the intercept for statistical significance at the 5% level of significance. if h and s both equal 0, are sales expected to be 0? explain why or why not? f. test the estimated coefficient b for statistical significance. if the dealership decreases its hours of operation by 10%, what is the expected impact on daily sales?
Answers: 2
You know the right answer?
On thursday carissa ate some cranberries. the next day she couldn't stop thinking about how good th...
Questions

Biology, 17.09.2019 23:00


Mathematics, 17.09.2019 23:00
Mathematics, 17.09.2019 23:00

History, 17.09.2019 23:00

English, 17.09.2019 23:00

Computers and Technology, 17.09.2019 23:00

Chemistry, 17.09.2019 23:00
Biology, 17.09.2019 23:00
English, 17.09.2019 23:00
Social Studies, 17.09.2019 23:00
History, 17.09.2019 23:00


