Pl
jeremy thinks that he drinks more water when it is hotter outside. for 11 weeks he records...

Mathematics, 31.01.2020 00:01 MogTaee
Pl
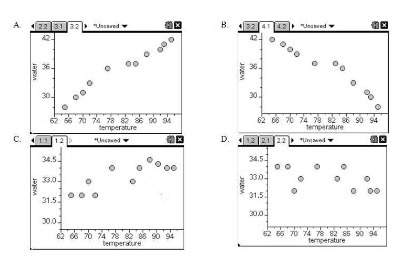
jeremy thinks that he drinks more water when it is hotter outside. for 11 weeks he records the average temperature for the week and his average daily water intake (in ounces). he then constructs a scatterplot and finds the line of best fit. his line of fit has a small positive slope.
which is most likely the scatterplot for this data set?

Answers: 2
Another question on Mathematics
Mathematics, 21.06.2019 16:00
Find the average speed of a rabbit that runs a distance of 22 m in a time of 1.8 s .
Answers: 1
Mathematics, 21.06.2019 19:30
If (17, 4) is an ordered pair of the inverse of f(x), which of the following is an ordered pair of the function f(x)? a. (17,4) b. (4.17) c. (4,0) d. 0,17)
Answers: 2
Mathematics, 21.06.2019 20:00
The table below represents a linear function f(x) and the equation represents a function g(x): x f(x) −1 −5 0 −1 1 3 g(x) g(x) = 2x − 7 part a: write a sentence to compare the slope of the two functions and show the steps you used to determine the slope of f(x) and g(x). (6 points) part b: which function has a greater y-intercept? justify your answer. (4 points)
Answers: 2
You know the right answer?
Questions
Mathematics, 30.05.2020 03:03

History, 30.05.2020 03:03

Mathematics, 30.05.2020 03:03

Geography, 30.05.2020 03:03

Advanced Placement (AP), 30.05.2020 03:03
Mathematics, 30.05.2020 03:03

Mathematics, 30.05.2020 03:03
History, 30.05.2020 03:03
Mathematics, 30.05.2020 03:03

Spanish, 30.05.2020 03:03


