
Mathematics, 21.09.2019 03:00 yaneli0717
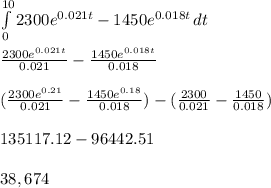
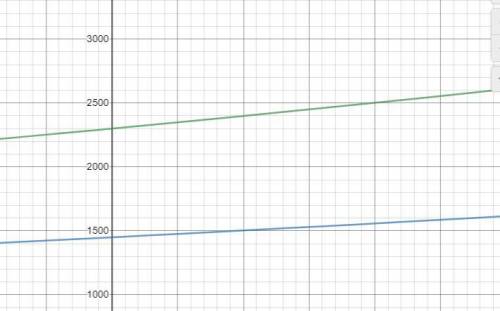
The birth rate of a population is b(t) = 2300e0.021t people per year and the death rate is d(t)= 1450e0.018t people per year, find the area between these curves for 0 ≤ t ≤ 10. (round your answer to the nearest integer.) people what does this area represent? this area represent the number of children through high school over a 10-year period. this area represents the increase in population over a 10-year period. this area represents the decrease in population over a 10-year period. this area represents the number of deaths over a 10-year period. this area represents the number of births over a 10-year period.

Answers: 1
Another question on Mathematics
Mathematics, 21.06.2019 17:50
Segment ab is shown on the graph. which shows how to find the x-coordinate of the point that will divide ab into a 2: 3 ratio using the formula
Answers: 2
Mathematics, 21.06.2019 19:30
Aregular pentagon with a perimeter of 21 inches is dilated by a scale factor of 5/3 to create a new pentagon. what is the perimeter of the new pentagon?
Answers: 2
Mathematics, 21.06.2019 19:50
Use composition to determine if (x) or h(x) is the inverse of f(x) for the limited domain x2-1.
Answers: 3
Mathematics, 21.06.2019 21:00
Emily is entering a bicycle race for charity. her mother pledges $0.90 for every 0.75 mile she bikes. if emily bikes 18 miles, how much will her mother donate?
Answers: 1
You know the right answer?
The birth rate of a population is b(t) = 2300e0.021t people per year and the death rate is d(t)= 145...
Questions
Mathematics, 01.10.2019 11:10

History, 01.10.2019 11:10

Chemistry, 01.10.2019 11:10


Mathematics, 01.10.2019 11:10

Social Studies, 01.10.2019 11:10
Chemistry, 01.10.2019 11:10
Mathematics, 01.10.2019 11:10
Mathematics, 01.10.2019 11:10
Chemistry, 01.10.2019 11:10

Social Studies, 01.10.2019 11:10


