
Mathematics, 07.10.2019 19:50 douglife8057
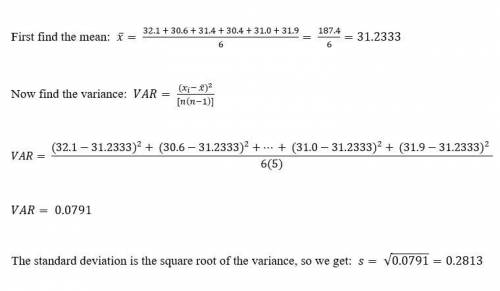
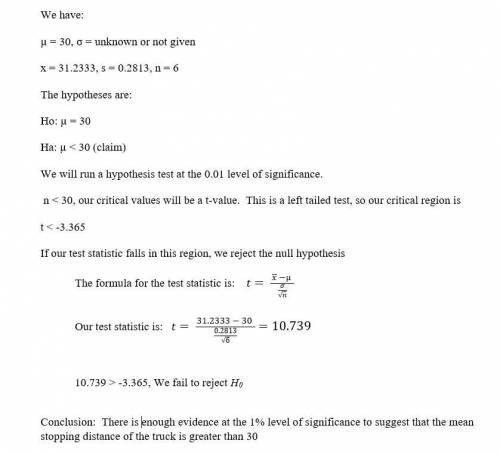
The following observations are on stopping distance (ft) of a particular truck at 20 mph under specified experimental conditions (“experimental measurement of the stopping performance of a tractor-semitrailer from multiple speeds,” nhtsa, dot hs 811 488, june 2011): 32.1 30.6 31.4 30.4 31.0 31.9 the cited report states that under these conditions, the maximum allowable stopping distance is 30. a normal probability plot validates the assumption that stopping distance is normally distributed. a. does the data suggest that true average stopping distance exceeds this maximum value? test the appropriate hypotheses using a 5 .01.

Answers: 1
Another question on Mathematics
Mathematics, 21.06.2019 15:30
Find the slope of the line below . enter your answer as a fraction or decimal. use a slash mark ( / ) as the fraction bar if necessary
Answers: 3
Mathematics, 21.06.2019 19:30
The wheels of a bicycle have a diameter of 70cm. how many meters will the bicycle travel if each wheel makes 50 revolutions
Answers: 2
Mathematics, 21.06.2019 20:40
Askate shop rents roller skates as shown on the table below. which graph and function models this situation?
Answers: 1
You know the right answer?
The following observations are on stopping distance (ft) of a particular truck at 20 mph under speci...
Questions

Mathematics, 08.11.2019 21:31

Mathematics, 08.11.2019 21:31
History, 08.11.2019 21:31
Mathematics, 08.11.2019 21:31

Chemistry, 08.11.2019 21:31

Computers and Technology, 08.11.2019 21:31


Social Studies, 08.11.2019 21:31
Mathematics, 08.11.2019 21:31
Mathematics, 08.11.2019 21:31
English, 08.11.2019 21:31
Chemistry, 08.11.2019 21:31


