
Mathematics, 30.01.2020 16:05 bartlettcs9817
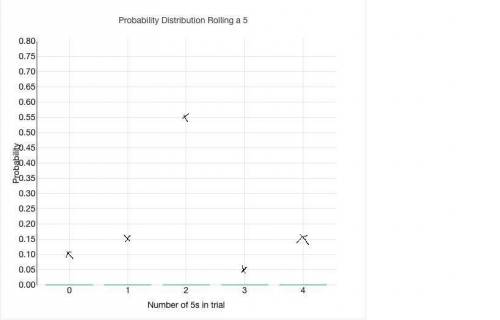
In an experiment, a number cube is rolled 4 times. the number of times a 5 shows is recorded. sixty trials of the experiment are run.
the table shows the frequency of any number of 5s occurring in the trials.
number of 5s 0 1 2 3 4
frequency 6 9 33 9 3
create a probability distribution for the discrete variable.
drag the sliders on the horizontal axis to represent the probability distribution.

Answers: 3
Another question on Mathematics
Mathematics, 21.06.2019 16:50
Factor -8x3-2x2-12x-3 by grouping what is the resulting expression?
Answers: 2
Mathematics, 21.06.2019 21:30
Name and describe the three most important measures of central tendency. choose the correct answer below. a. the mean, sample size, and mode are the most important measures of central tendency. the mean of a data set is the sum of the observations divided by the middle value in its ordered list. the sample size of a data set is the number of observations. the mode of a data set is its highest value in its ordered list. b. the sample size, median, and mode are the most important measures of central tendency. the sample size of a data set is the difference between the highest value and lowest value in its ordered list. the median of a data set is its most frequently occurring value. the mode of a data set is sum of the observations divided by the number of observations. c. the mean, median, and mode are the most important measures of central tendency. the mean of a data set is the product of the observations divided by the number of observations. the median of a data set is the lowest value in its ordered list. the mode of a data set is its least frequently occurring value. d. the mean, median, and mode are the most important measures of central tendency. the mean of a data set is its arithmetic average. the median of a data set is the middle value in its ordered list. the mode of a data set is its most frequently occurring value.
Answers: 3
Mathematics, 21.06.2019 23:30
Will give brainliest for correct answer 8. use the distance time graph to answer these questions: a. what does the graph tell us about the velocity of the car? b. what is the average velocity of the car? (show work) c. is the velocity reflected in the graph positive or negative?d. is there any point on the graph where the car is not moving? how do we know?
Answers: 1
Mathematics, 21.06.2019 23:40
From the top of a tree a bird looks down on a field mouse at an angle of depression of 50°. if the field mouse is 40 meters from the base of the tree, find the vertical distance from the ground to the bird's eyes.
Answers: 1
You know the right answer?
In an experiment, a number cube is rolled 4 times. the number of times a 5 shows is recorded. sixty...
Questions


Computers and Technology, 25.02.2021 22:10
Mathematics, 25.02.2021 22:10
Mathematics, 25.02.2021 22:10
Mathematics, 25.02.2021 22:10

Mathematics, 25.02.2021 22:10
History, 25.02.2021 22:10

Spanish, 25.02.2021 22:10


English, 25.02.2021 22:10


