
Mathematics, 02.07.2019 21:10 Kianaxo
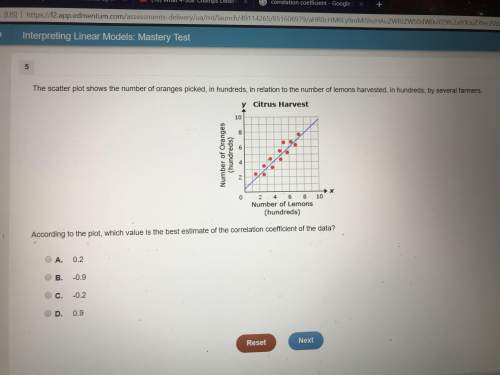
The scatter plot shows the number of oranges picked, in hundreds, in relation to the number of lemons harvested, in hundreds, by several farmers. according to the plot, which value is the best estimate of the correlation coefficient of the data?
answers are in picture

Answers: 3
Another question on Mathematics
Mathematics, 21.06.2019 15:40
Sara needs to take a taxi to get to the movies the taxi charges $4.00 for the first mile and then $2.75 for each mile after that if the total charge is $20.50 then how far was sara’s taxi ride to the movie
Answers: 2
Mathematics, 21.06.2019 20:10
Which expression do you get when you eliminate the negative exponents of 4a^2 b^216a^-3 b
Answers: 3
Mathematics, 21.06.2019 21:30
Ahypothesis is: a the average squared deviations about the mean of a distribution of values b) an empirically testable statement that is an unproven supposition developed in order to explain phenomena a statement that asserts the status quo; that is, any change from what has been c) thought to be true is due to random sampling order da statement that is the opposite of the null hypothesis e) the error made by rejecting the null hypothesis when it is true
Answers: 2
You know the right answer?
The scatter plot shows the number of oranges picked, in hundreds, in relation to the number of lemon...
Questions

History, 27.05.2021 21:40

Mathematics, 27.05.2021 21:50

Physics, 27.05.2021 21:50

Mathematics, 27.05.2021 21:50
Mathematics, 27.05.2021 21:50
Mathematics, 27.05.2021 21:50
Mathematics, 27.05.2021 21:50
Mathematics, 27.05.2021 21:50


