
Mathematics, 12.07.2019 05:10 juliannabartra
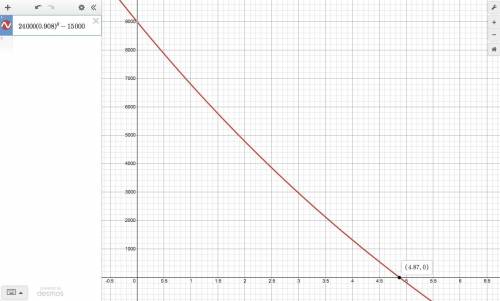
there are 24,000 square miles of forest in a western state. forest fires decrease this area by 9.2% each year. the state needs to have more than 15,000 square miles of forest to keep their funding from a nonprofit wildlife organization.
which inequality represents this situation, and if the fires continue to decrease the area of the forests at the same rate, will the state be able to keep their funding from the nonprofit wildlife organization in 5 years?
24,000(1.092)t > 15,000; no
24,000(0.092)t > 15,000; yes
24,000(0.908)t > 15,000; no
24,000(1.098)t > 15,000; yes

Answers: 1
Another question on Mathematics
Mathematics, 21.06.2019 18:30
Afarm that has 4 x 10^2 acres has 1.2 x 10^5 cattle. what is the average number of cattle per acre? write the answer in scientific notation. answere asap
Answers: 1
Mathematics, 21.06.2019 19:30
What is the effect on the graph of the function f(x)=x when f(x) is replaced with -f(x)+4
Answers: 1
Mathematics, 21.06.2019 20:00
Pepe and leo deposits money into their savings account at the end of the month the table shows the account balances. if there pattern of savings continue and neither earns interest nor withdraw any of the money , how will the balance compare after a very long time ?
Answers: 1
Mathematics, 22.06.2019 03:00
Describe how the presence of possible outliers might be identified on the following. (a) histograms gap between the first bar and the rest of bars or between the last bar and the rest of bars large group of bars to the left or right of a gap higher center bar than surrounding bars gap around the center of the histogram higher far left or right bar than surrounding bars (b) dotplots large gap around the center of the data large gap between data on the far left side or the far right side and the rest of the data large groups of data to the left or right of a gap large group of data in the center of the dotplot large group of data on the left or right of the dotplot (c) stem-and-leaf displays several empty stems in the center of the stem-and-leaf display large group of data in stems on one of the far sides of the stem-and-leaf display large group of data near a gap several empty stems after stem including the lowest values or before stem including the highest values large group of data in the center stems (d) box-and-whisker plots data within the fences placed at q1 â’ 1.5(iqr) and at q3 + 1.5(iqr) data beyond the fences placed at q1 â’ 2(iqr) and at q3 + 2(iqr) data within the fences placed at q1 â’ 2(iqr) and at q3 + 2(iqr) data beyond the fences placed at q1 â’ 1.5(iqr) and at q3 + 1.5(iqr) data beyond the fences placed at q1 â’ 1(iqr) and at q3 + 1(iqr)
Answers: 1
You know the right answer?
there are 24,000 square miles of forest in a western state. forest fires decrease this area by 9.2%...
Questions


English, 13.12.2020 08:10

Mathematics, 13.12.2020 08:10

Business, 13.12.2020 08:10

Mathematics, 13.12.2020 08:10
Mathematics, 13.12.2020 08:10

English, 13.12.2020 08:10

Computers and Technology, 13.12.2020 08:10


