30 points. need asap
part a
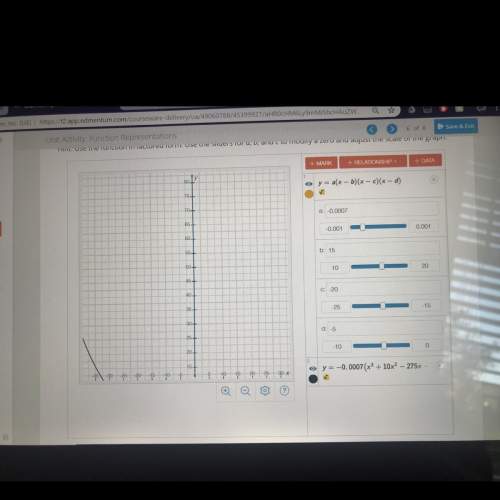
describe the type of function shown in the graph.
pa...

Mathematics, 20.07.2019 07:10 hailee6053
30 points. need asap
part a
describe the type of function shown in the graph.
part b
what are the standard form and factored form of the function?
part c
what are the series of the function?
part d
use the series to find all the linear factors of the polynomial function
part e
write the equation of the graphed function f(x), where a is the leading coefficient. use the factors found in part d. express the function as the product of it's leading coefficient and the form of the equation in standard form.
part f
use the y intercept of the graph and your equation from part e to calculate the value of a.
part g
given what you found in all the previous parts, write the equation for the function shown in the graph.
part h
plot the graph of the function you wrote in part g

Answers: 3
Another question on Mathematics
Mathematics, 21.06.2019 12:30
Option 1: $30 an hour plus a nonrefundable deposit of $50 option 2: $20 an hour plus a nonrefundable deposit of $75 kyle is renting a jetski for the day. if he can rent the jetski in one hour increments, what is the minimum number of hours must he rent the jetski for option 2 to be a better deal then option 1?
Answers: 1
Mathematics, 21.06.2019 19:30
Michelle and julie work at a catering company. they need to bake 264 cookies for a birthday party that starts in a little over an hour and a half. each tube of cookie dough claims to make 36 cookies, but michelle eats about 1/5 of every tube and julie makes cookies that are 1.5 times as large as the recommended cookie size.it takes about 8 minutes to bake a container of cookies, but since julie's cookies are larger, they take 12 minutes to bake. a. how many tubes should each girl plan to bake? how long does each girl use the oven? b. explain your solution process what did you make? c. what assumptions did you make?
Answers: 1
Mathematics, 21.06.2019 21:00
These box plots show the number of electoral votes one by democratic and republican presidential candidates for the elections from 1984 through 2012. which statement best compares the spread of the data sets
Answers: 2
You know the right answer?
Questions


History, 02.08.2019 18:00

Mathematics, 02.08.2019 18:00

History, 02.08.2019 18:00

Chemistry, 02.08.2019 18:00


History, 02.08.2019 18:00

Chemistry, 02.08.2019 18:00


