
Mathematics, 24.07.2019 18:10 kivking12
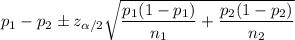
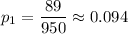
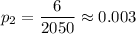
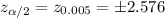
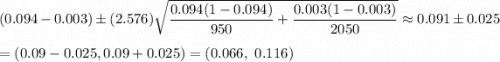
(1 pt) in a study of red/green color blindness, 950 men and 2050 women are randomly selected and tested. among the men, 89 have red/green color blindness. among the women, 6 have red/green color blindness. construct the 99% confidence interval for the difference between the color blindness rates of men and women.

Answers: 1

Another question on Mathematics
Mathematics, 21.06.2019 17:40
Bradley hikes 12 miles in 3 hours. in relation to bradley’s hike, which statement describes the expression
Answers: 2
Mathematics, 21.06.2019 19:00
Acompany manufactures large valves, packed in boxes. a shipment consists of 1500 valves packed in 75 boxes. each box has the outer dimensions 1.2 x 0.8 x 1.6 m and the inner dimensions 1.19 x 0.79 x 1.59 m. the boxes are loaded on a vehicle (truck + trailer). the available capacity in the vehicle combination is 140 m3. each valve has a volume of 0.06 m3. - calculate the load factor on the box level (%). - calculate the load factor on the vehicle level (%). - calculate the overall load factor (%).
Answers: 1
Mathematics, 21.06.2019 19:30
Koji is installing a rectangular window in an office building. the window is 823 feet wide and 534 feet high. the formula for the area of a rectangle is a=bh. what is the area of the window? enter your answer as a mixed number in simplest form in the box. $$ ft2
Answers: 1
Mathematics, 21.06.2019 21:30
Name and describe the three most important measures of central tendency. choose the correct answer below. a. the mean, sample size, and mode are the most important measures of central tendency. the mean of a data set is the sum of the observations divided by the middle value in its ordered list. the sample size of a data set is the number of observations. the mode of a data set is its highest value in its ordered list. b. the sample size, median, and mode are the most important measures of central tendency. the sample size of a data set is the difference between the highest value and lowest value in its ordered list. the median of a data set is its most frequently occurring value. the mode of a data set is sum of the observations divided by the number of observations. c. the mean, median, and mode are the most important measures of central tendency. the mean of a data set is the product of the observations divided by the number of observations. the median of a data set is the lowest value in its ordered list. the mode of a data set is its least frequently occurring value. d. the mean, median, and mode are the most important measures of central tendency. the mean of a data set is its arithmetic average. the median of a data set is the middle value in its ordered list. the mode of a data set is its most frequently occurring value.
Answers: 3
You know the right answer?
(1 pt) in a study of red/green color blindness, 950 men and 2050 women are randomly selected and tes...
Questions


Spanish, 16.11.2019 09:31
Spanish, 16.11.2019 09:31
Mathematics, 16.11.2019 09:31


English, 16.11.2019 09:31
English, 16.11.2019 09:31

Social Studies, 16.11.2019 09:31

Mathematics, 16.11.2019 09:31
Spanish, 16.11.2019 09:31


