Which table of values will generate this graph?
table a:
x: -3, -1, 1
y: -2, 0...

Mathematics, 03.08.2019 11:10 jambunny26
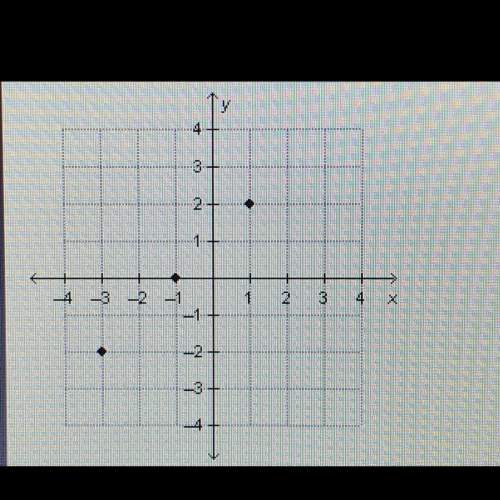
Which table of values will generate this graph?
table a:
x: -3, -1, 1
y: -2, 0, 2
table b:
x: -3, 0, 1
y: -2, -1, 2
table c:
x: -2, 0, 2
y: -3, -1, 1
table d:
x: -2, -1, 2
y: -3, 0, 1

Answers: 3
Another question on Mathematics
Mathematics, 21.06.2019 13:30
Which of the fallowing best completes the sequence 5,10,15, a) 30 b) 22 c)25 d)35
Answers: 2
Mathematics, 21.06.2019 14:10
Plzzz plzz maths ! quadratic sequences =an^2+bn 1) 1,6,15,28,45 2)5,18,39,68,105 3) 1,8,21,40,65 4) 7,24,51,88,135 5) -1,2,9,20,35
Answers: 3
Mathematics, 21.06.2019 17:00
You are on a cycling trip around europe with friends. you check the weather forecast for the first week. these are the temperatures for the week. sun mon tues wed thurs fri sat 16°c 20°c 24°c 28°c 28°c 23°c 15°c what is the mean temperature forecast for the week?
Answers: 1
You know the right answer?
Questions

Chemistry, 27.01.2021 21:40
Mathematics, 27.01.2021 21:40


Social Studies, 27.01.2021 21:40

Business, 27.01.2021 21:40
Mathematics, 27.01.2021 21:40
Mathematics, 27.01.2021 21:40
Mathematics, 27.01.2021 21:40

Mathematics, 27.01.2021 21:40
Mathematics, 27.01.2021 21:40
Chemistry, 27.01.2021 21:40
Mathematics, 27.01.2021 21:40


